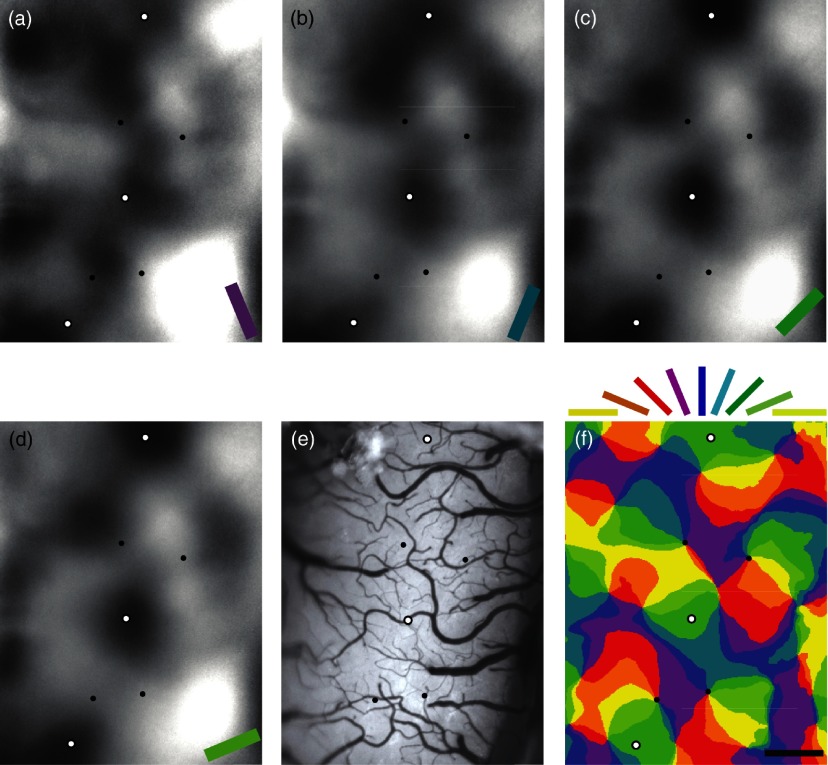
Fig. 1.
Intrinsic signal optical imaging of the orientation map on the dorsal surface of a cat’s primary visual cortex (V1). (a–d) Example single condition orientation maps are shown. Dark regions indicate areas of high neural activity for stimuli at (a) , (b) , (c) , and (d) . (e) Reference image of the surface blood vessel pattern. (f) Orientation preference map. Each orientation domain is color coded at 22.5-deg orientation increments; legend is shown above. Scale bar is . In all panels, the open and solid dots highlight domain and pinwheel sites selected suitable for targeting microelectrodes for single-unit recordings.

