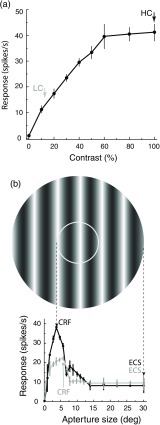
Fig. 2.
CRF and ECS identification. (a) For this example neuron, 100% contrast elicits the maximum response (black arrow) and is chosen as the HC. The percent-contrast eliciting 30% of the maximum response is 11% (gray arrow) and is chosen as the LC. (b) Aperture tuning curves at HC (black trace) and LC (gray trace) are shown. The grating stimulus pictured above indicates the HC CRF (inner white circle) and the HC ECS (outer edge of the whole aperture), with dashed arrows pointing to the corresponding peak response at 3.5 deg and the point of subsequent maximum suppression at 30 deg. Due to LC summation the CRF size at LC is slightly larger, 5 deg (gray arrow), as indicated by the rightward shift of the peak response of the gray tuning curve. The LC ECS is selected as 30 deg.

