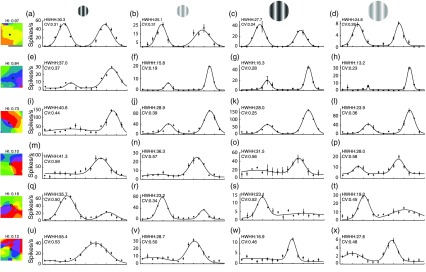
Fig. 3.
Orientation tuning of representative V1 neurons relative to contrast, size, and location in the V1 orientation map. Orientation tuning curves are shown for six example neurons, three domain cells (a–d, e–h, and i–l), and three pinwheel cells (m–p, q–t, and u–x), in response to four stimulus conditions: HC CRF (a, e, i, m, q, and u; column 1), LC CRF (b, f, j, n, r, and v; column 2), HC CRF+ECS (c, g, k, o, s, and w; column 3), and LC CRF+ECS (d, h, l, p, t, and x; column 4). For these example cells, tuning width is broadest for the HC CRF condition (column 1). For the other three conditions (columns 2 to 4), tuning is sharper and relatively similar within cells (across each row). The largest differences in tuning width between domain and pinwheel cells are found for the HC CRF condition (column 1). Tuning width is measured as the HWHH as indicated in the left column, and corresponding values are given. CV values are also given for comparison. To the left of each tuning curve row, the recording locations are shown (black/white circle) in the center of regions of the V1 orientation map. The orientation selectivity of the local environment (180-deg radius) is quantified by a HI. .

