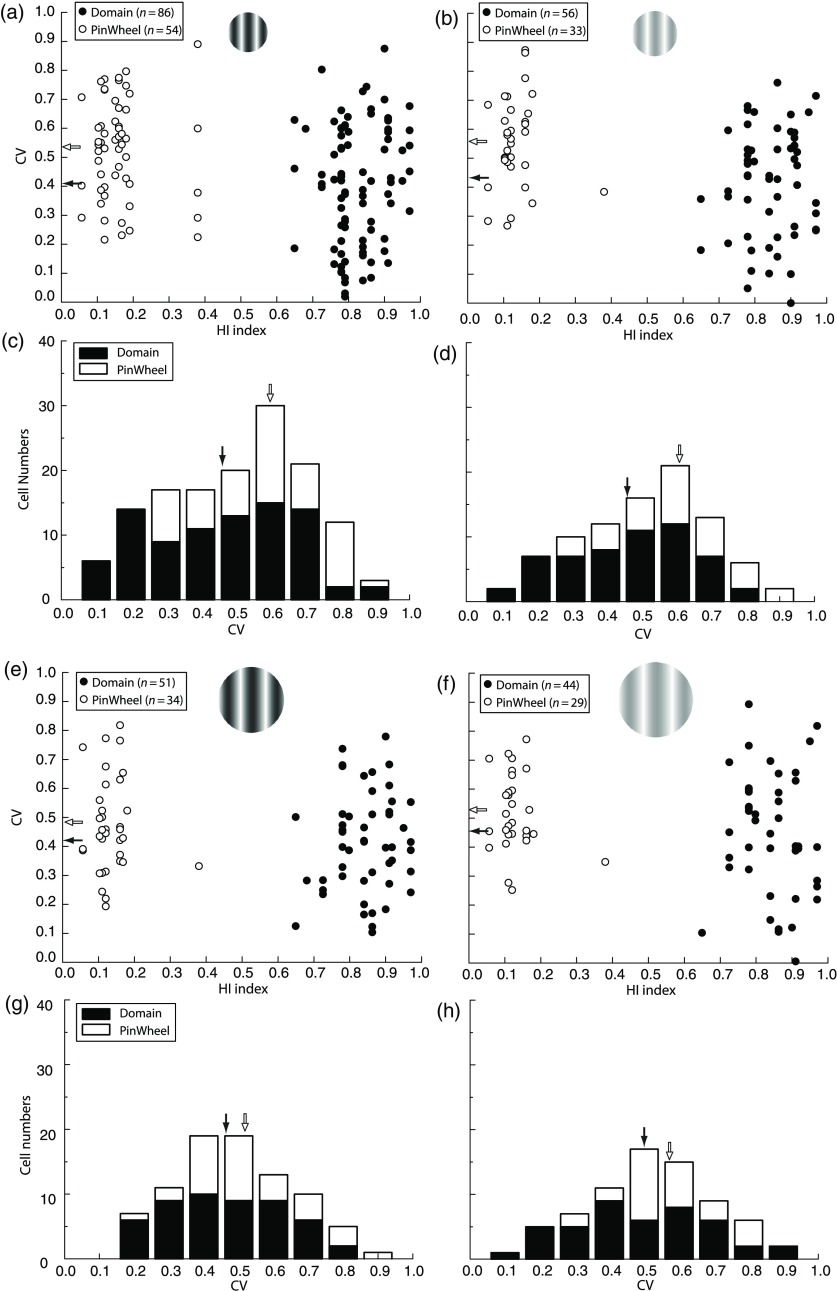
Fig. 6.
Population CV of the pinwheel neurons is generally higher than domain neurons under multiple stimulus conditions. Scatter plots show the relationship between CV (-axis) and HI (-axis) for the HC CRF (a) and CRF+ECS (e) and the LC CRF (b) and CRF+ECS (f). Mean HWHH is indicated for domain and pinwheel neurons by black and white filled arrowheads, respectively. To facilitate comparisons, the number of cells at each CV is presented in the bar graph in (c, d and g, h). The CRF condition results in significantly higher average CV for pinwheel compared to domain neurons at both high (a, c; versus ; ) and low (b, d; versus ; ) contrast. Higher average CV for pinwheel neurons is also found for the CRF+ECS at high (e, g) and low (f, h) contrast, but the difference with domain neurons is not significant (see Sec. 3).

