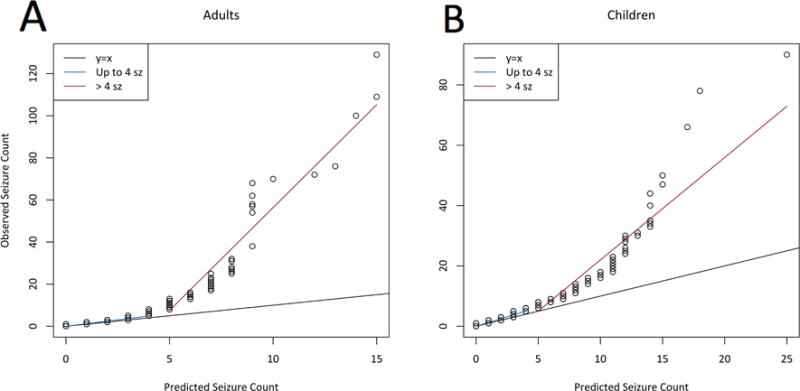
Figure 2.

(a) Quantile-quantile (QQ) plot for adult data, comparing distribution of simulated seizure count data from our model to observed seizure count data in the testing set. Two distinct regimes are highlighted: For ≤4 seizures per day, the data closely follows the one-to-one line, indicating that our model is valid for this range; above this point, data is nonlinear. (b) QQ plot for pediatric data. As in the adult data, there are two distinct regimes; the model is adequate for the lower regime.
