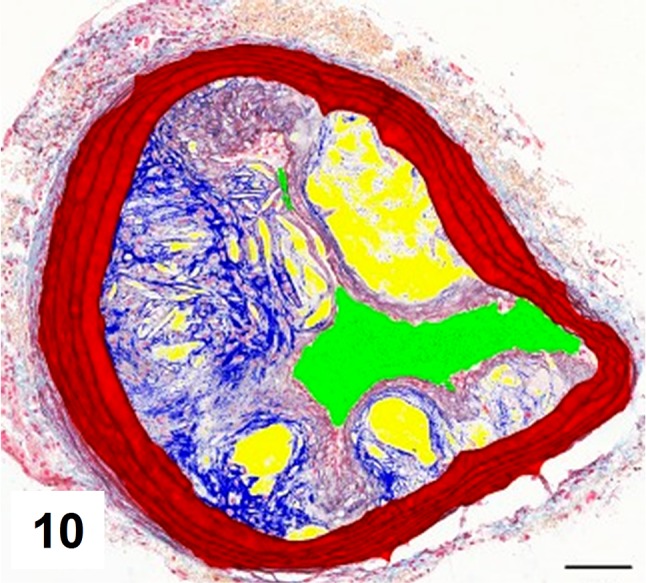
Fig. 10.

Results of automatic segmentation and pseudocoloring of the image from Fig. 9. Specific tissue areas overlying original image showing vessel media (red 161,749 μm2/33,58%), lumen (green 36,900 μm2/7,66%), plaque (calculated, 283,017 μm2/58,75%), collagen (blue 41,446 μm2/14,64%), and lipids (yellow 37,317 μm2/13,18%)
