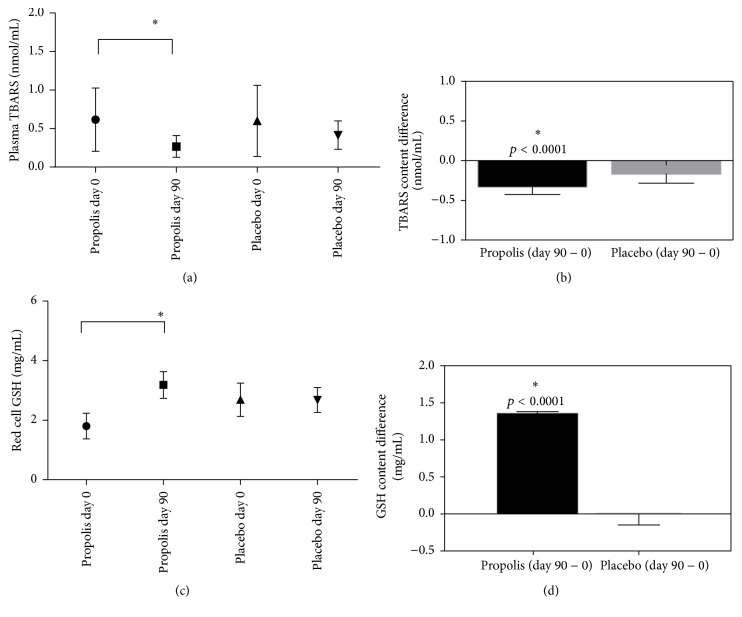
Figure 4.
Oxidative parameters in study group. Oxidative stress was assayed by TBARS (a), net changes (day 90 − 0) in TBARS (b), reduced glutathione GSH (c), and net changes (day 90 − 0) in GSH (d). Values correspond to mean ± SD for 32 placebo subjects and 35 propolis subjects. Significance was evaluated by one-way ANOVA and Tukey's posttest ((a) and (c) ∗p < 0.05) or t Test ((b) and (d) ∗p < 0.05).

