
Figure 4.
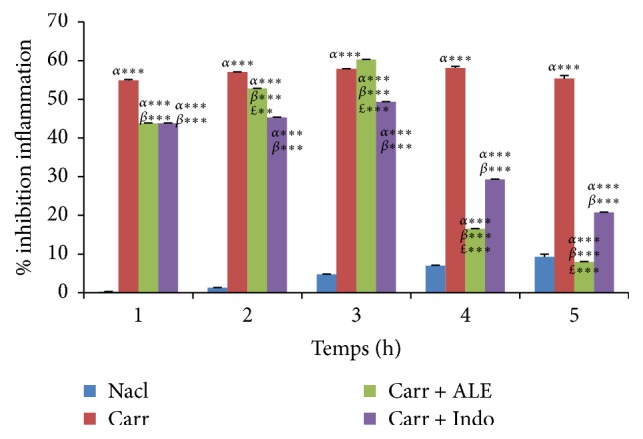
Percentage (%) of oedema inflammation data in all groups. Values represent mean ± SD (n = 6) in each group. ∗p < 0.05, ∗∗p < 0.01, and ∗∗∗p < 0.001. α: compared to control group, β: compared to Carr group, and £: compared to Indo group.
Official websites use .gov
A
.gov website belongs to an official
government organization in the United States.
Secure .gov websites use HTTPS
A lock (
) or https:// means you've safely
connected to the .gov website. Share sensitive
information only on official, secure websites.
Percentage (%) of oedema inflammation data in all groups. Values represent mean ± SD (n = 6) in each group. ∗p < 0.05, ∗∗p < 0.01, and ∗∗∗p < 0.001. α: compared to control group, β: compared to Carr group, and £: compared to Indo group.