
Figure 5.
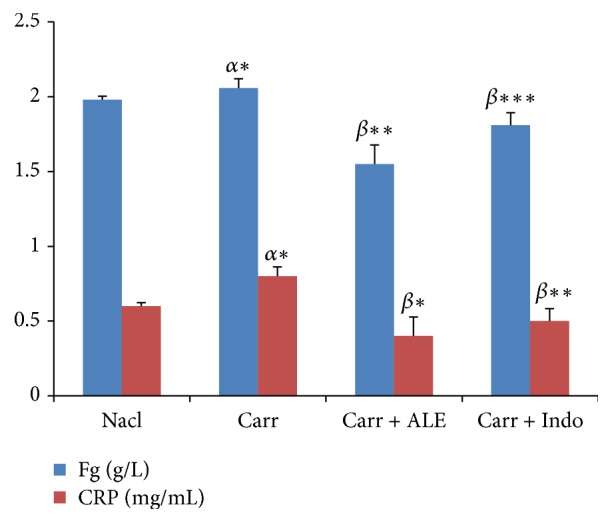
Levels of fibrinogen (Fg) and C-reactive protein (CRP). Values represent mean ± SD (n = 6) in each group. ∗p < 0.05, ∗∗p < 0.01, and ∗∗∗p < 0.001. α: compared to control; β: compared to Carr group. Fibrinogen (Fg). C-reactive protein (CRP).