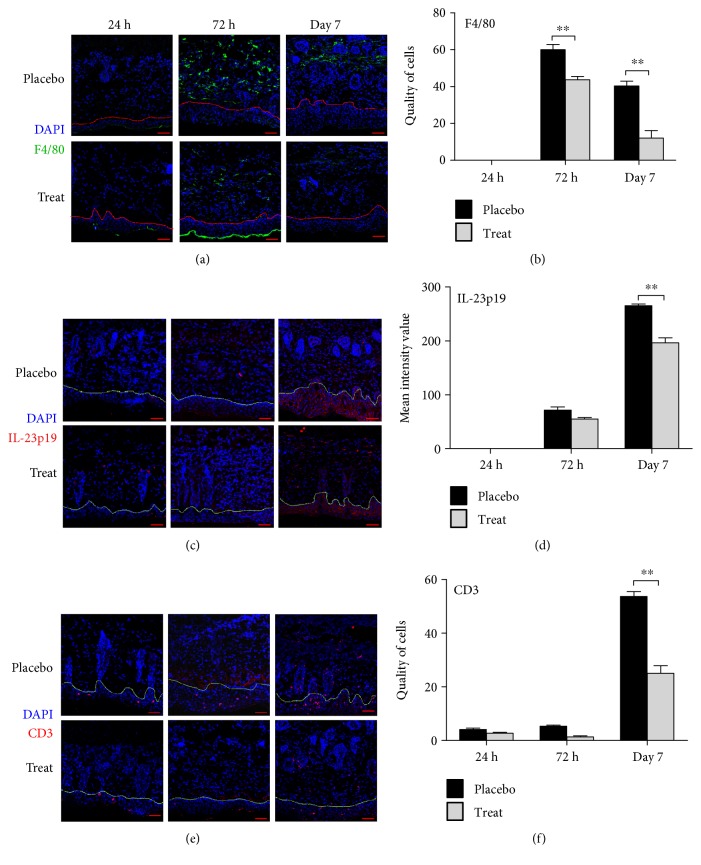
Figure 6.
Analysis of inflammatory infiltrates in the affected skin of mice with a psoriasis-like disease by laser confocal microscopy. (a1) Anti-mouse F4/80+ (green) and DAPI (blue); (a2) mean quantity of cells per square area. (b1) Anti-mouse IL-23p19 (red) and DAPI (blue); (b2) mean intensity value per square area. (c1) Anti-mouse CD3+ (red) and DAPI (blue); (c2) mean quantity of cells per square area. A representative image is given from each of three independent experiments. Scale bars represent 50 μm. ∗∗P < 0.01. Bars represent mean ± SEM (n = 3).

