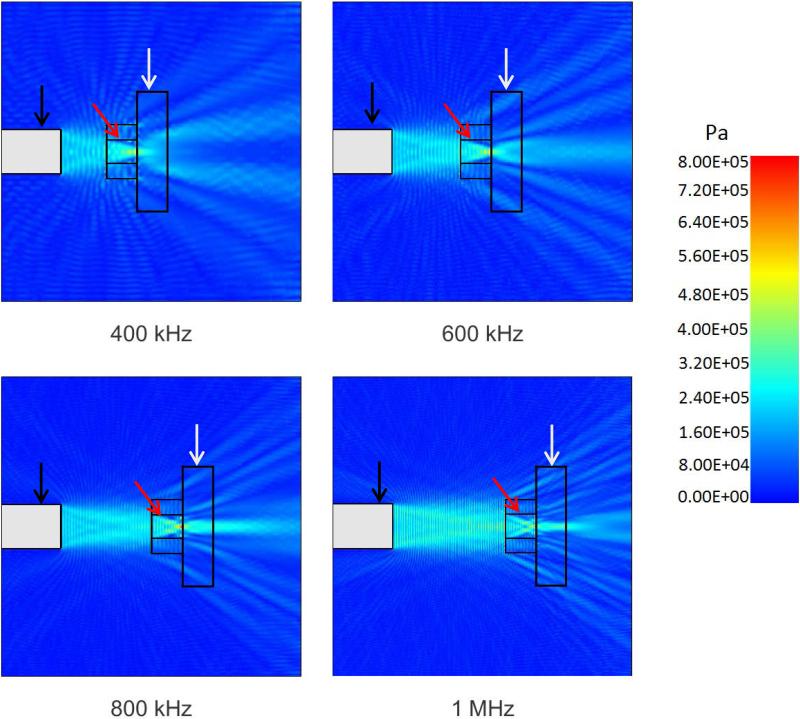
Figure 2.
Simulated pressures in the water bath experimental setup during ultrasound application at different frequencies (view from top). Simulations were done using PZFlex modeling software. Ultrasound transducer is shown with the black arrow, cell exposure chamber is shown with the red arrow, and acoustic absorber with the white arrow.

