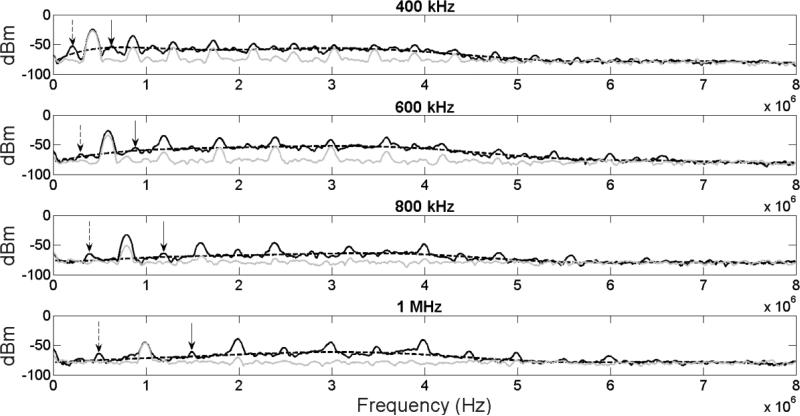
Figure 6.
Spectra obtained using PCD during ultrasound application for stimulation of pancreatic beta cells (solid black curve, intensity of 1 W/cm2, frequencies of 400-1000 kHz). Subharmonics (dashed black arrows), ultraharmonics (solid black arrows) and broadband noise were observed in all cases at the parameters used in the beta cells stimulation experiments. Inertial cavitation was estimated by the eighth-order polynomial fitting of the four frequency spectra (dashed curve). Spectra obtained at an intensity of 0.1 W/cm2 is represented by a solid gray curve (for comparison reasons).

