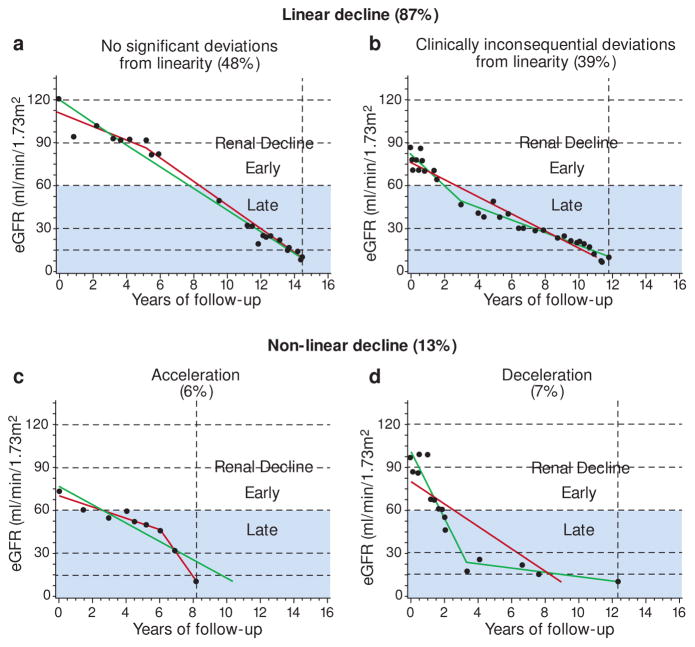
Figure 2.
Examples and frequencies of trajectories of eGFR decline in the Joslin ESRD cohort, classified as linear or non-linear by a linear spline approach.
Trajectories were classified by comparing linear (solid gray line) and spline (solid black line) regression models. Dots represent eGFR observations, horizontal gridlines are boundaries of CKD stages, and vertical interrupted line indicates onset of ESRD. Grey area distinguishes late from early progressive renal decline.
Figure adapted from Skupien et al. Diabetes Care 2016.6

