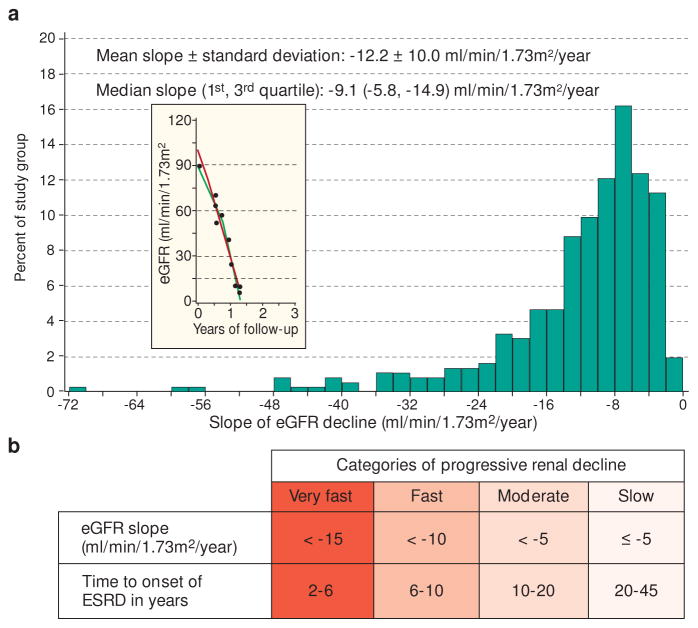
Figure 3.
Distribution of eGFR slopes in 364 patients in the Joslin ESRD cohort
Panel A: Histogram of the distribution of slopes of eGFR; insert – a trajectory of renal decline in a patient with the steepest slope(indicated with the arrow).
Panel B: Proposed categories for the slopes in Panel A
Re-analyzed data from Skupien et al. Diabete Care 2016.6

