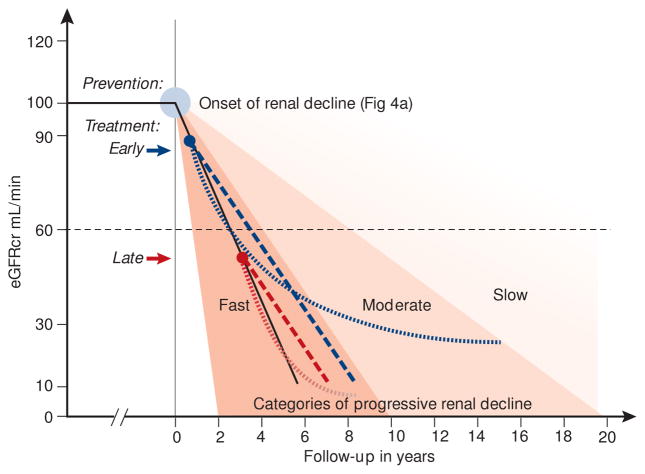
Figure 6.
Schematic representation of eGFR trajectories in fast decliners and their modifications in response to different interventions to reduce the rate of decline and postpone the risk of ESRD.
Intervention with a treatment that effectively reduces the rate of decline will postpone the onset of ESRD by a longer interval depending on how soon after the onset of decline the intervention occurs (dashed red and blue lines).
Evidence of an effective treatment may not be visible until after a lag interval (as described by Skupien et al. JASN 201431). That effect will not be realized, however, if the treatment is initiated too late (dotted red and blue lines).
In moderate and slow decliners, the effects of the treatments illustrated above, will be more pronounced. An immediate treatment effect (straight lines) would result in a greater delay in ESRD, and a lagged treatment effect (curves) would result in a higher residual eGFR. However, demonstrating these effects would require clinical trials longer than 3 years and different definition of end-point measures, e.g. deceleration of eGFR slopes or other more sensitive surrogates.

