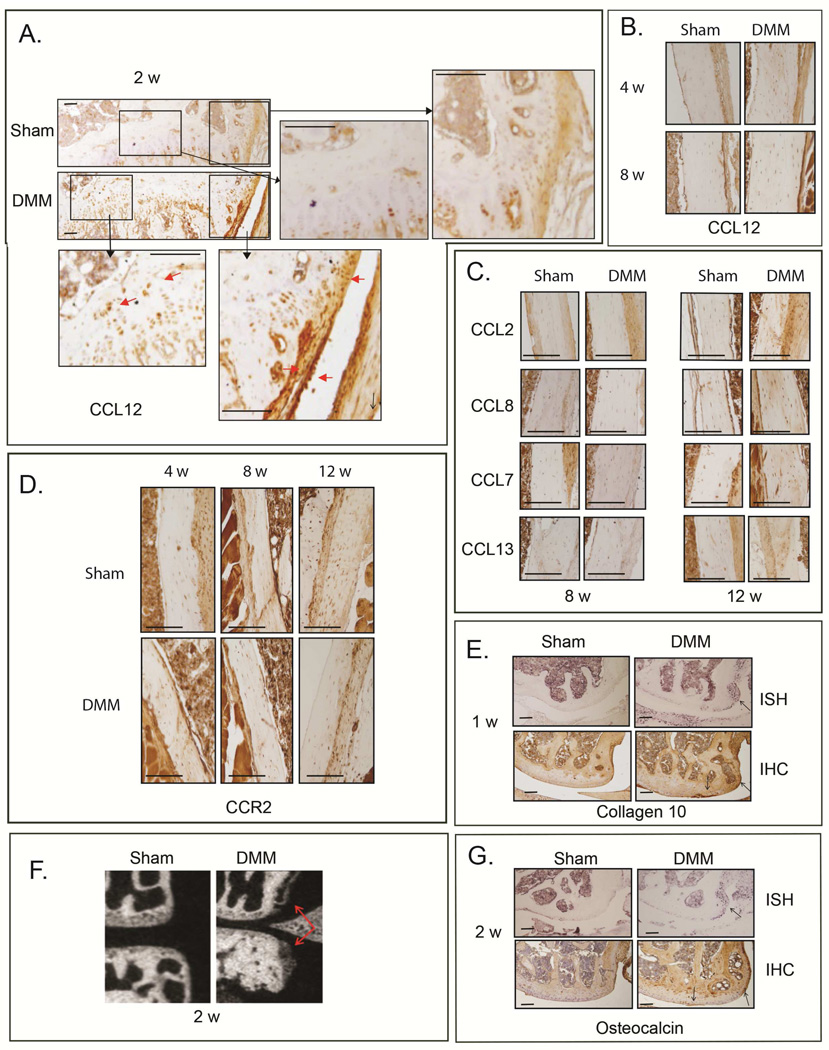
Figure 3. Protein levels of CCL12, CCR2 and other CCR2 ligands in bone cell compartments during DMM-induced OA.
Protein levels of CCL12 were visualized by IHC in the bone tissues (A) 2 wks after DMM/sham, as well as (B) 4 and 8 wks post-surgery. Protein levels of (C) CCL2, CCL8, CCL7, CCL13, as well as (D) CCR2 were visualized in bone tissue by IHC at the indicated time points. (E) Protein levels and mRNA expression of Col10 were visualized by IHC and ISH, respectively, in medial femurs obtained from mice 1wk after DMM/sham surgery. Osteophytes were visualized by (F) μCT analyses and (G) OCN protein/mRNA levels (IHC and ISH) in medial femurs and tibiae obtained from mice 2wks after DMM/sham surgery. Images are representative of 6 different mice for each of the experimental points described. Scale bars are 100 µm.

