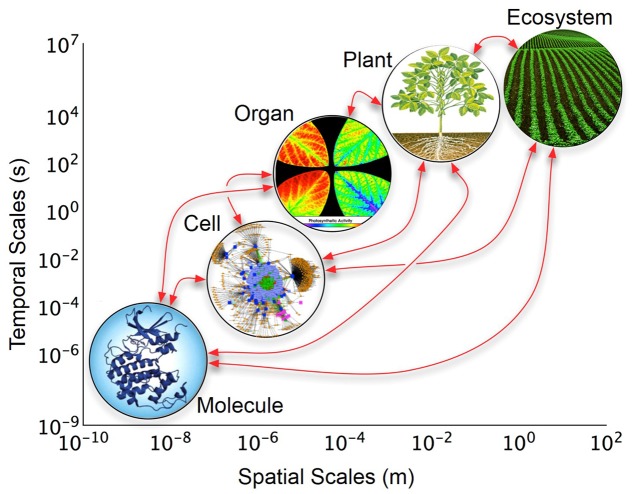
FIGURE 1.
Layers of organization of biological models across temporal and spatial scales. The y-axis represents real-time in which changes occur at each biological level; the x-axis represents the relative size or space which the biological level encompasses. The arrows indicate possible direct interactions among scales. Organ level image is from Kim et al. (2001).

