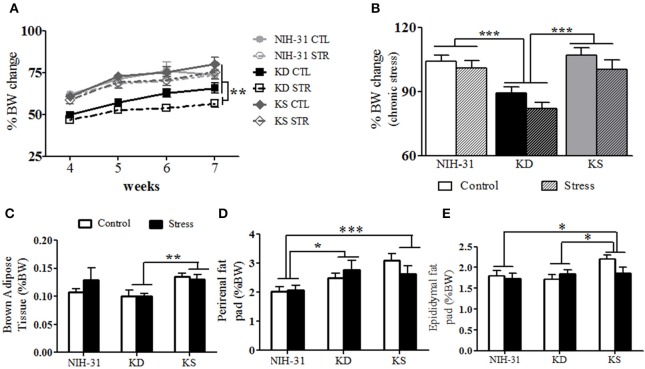
Figure 6.
Anatomical changes at euthanasia following chronic exposure to stressors. (A) Following exposure to stressors, main effects of diet (p < 0.0001) and stress (p = 0.04) were observed, with KD-fed rats exposed to stress displaying significantly lower body weight changes. (B) Averaged percentage of body weight change values during the stress exposure period showed main effects of diet (p < 0.001) and stress (p = 0.04) and showed that KD groups showed consistent lower weight gain. (C) KS-fed rats showed increased brown adipose tissue weight (BAT, normalized to body weight) in comparison to KD-fed group (p = 0.002). (D) Normalized perirenal fat pad weights were larger in both KD and KS in comparison to NIH-31-fed groups (p = 0.01 and p = 0.0006, respectively). (E) A trend for main effect of diet (p = 0.07) was observed with normalized epididymal fat pad weights, with increased weights in KS groups, compared to both NIH-31 (p = 0.03) and KD (p = 0.04) groups. Data represented as mean ± S.E.M. (n = 9–10/group). *p < 0.05; **p < 0.01, and ***p < 0.001.

