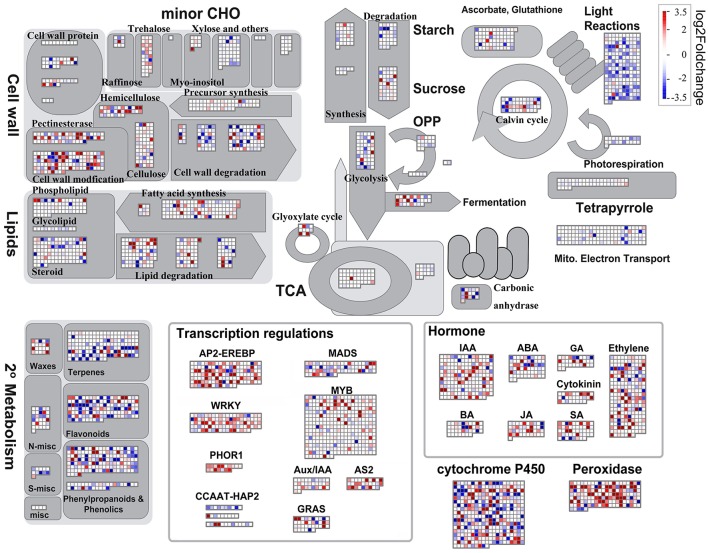
Figure 2.
Biological pathways responded to submergence through transcriptional regulation. Overview of MapMan biological pathways to illustrate differentially expressed transcripts between control and submerged tissues. The log2 fold change color scale ranges from −3.5 to 3.5, with red representing higher gene expression in submerged coleoptiles compared to control shoot tissues, and dark blue representing higher gene expression in control samples compared to submerged coleoptiles. The complete set of genes and calculated ratios is presented in Table S13.

