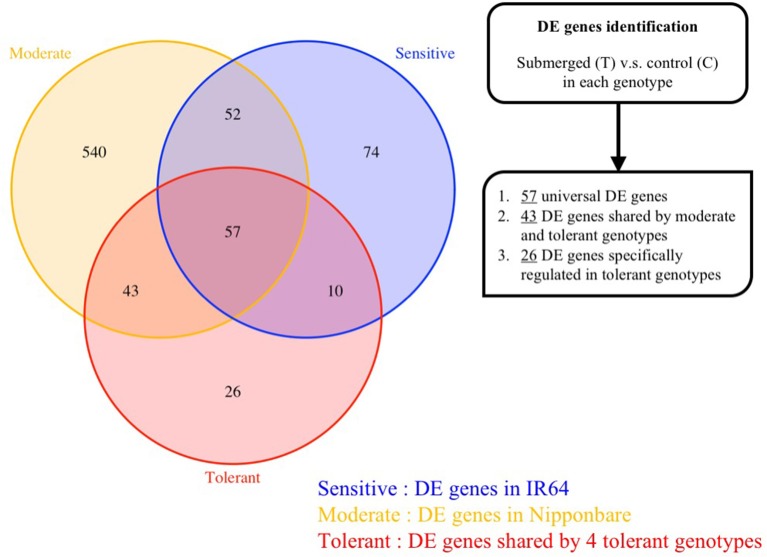
Figure 4.
DE genes identified by comparing expression between control and submerged shoots in each genotype. Three-way Venn diagram to illustrate the number of DE genes that are either unique to, or shared between genotypes. The colored lines correspond to tolerance level described in Figure 1. The number in each block indicates the number of DE genes in each group.

