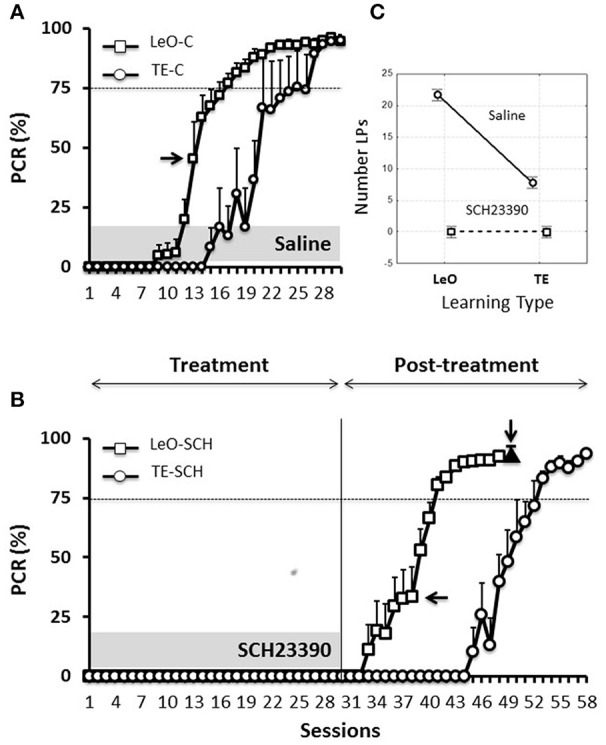
Figure 3.

Learning profiles in controls and experimental rats. Learning is represented as the change in the percentage correct responses (PCR). (A) Evolution of the PCR in control groups (saline injections). The symbols represent mean PCR for 6 rats, and the bars represent the standard error of the mean (sem). Triangles, trial-and-error (TE) group; Squares, observational learning (LeO) group. The dashed horizontal line represents the learning criterion (75%). Horizontal arrow points to the 1st session at which differences between groups start to be significant (Tukey HSD post-hoc test, P < 0.05). (B) Evolution of the PCR in rats infused with SCH23390. Same conventions as in (A). The black triangle (indicated by the vertical arrow) represents the PCR for injections of SCH23390 at session 49, i.e., after learning. (C) Treatment × learning type interaction, F(2, 599) = 108.14, P < 0001. The plot shows the mean number of lever pushes (LPs) plotted for each learning type (LeO vs. TE), as a function of treatment (Saline vs. SCH23390).
