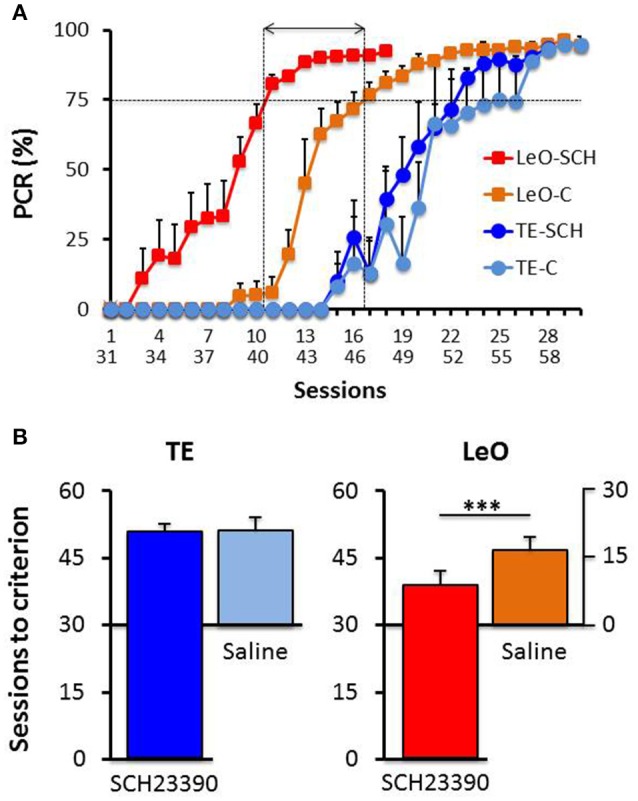
Figure 4.

Post-treatment learning: comparison with controls. (A) The PCR values are plotted as a function of sessions, superimposed for the experimental groups TE-SCH (dark blue), LeO-SCH (red; sessions 31–58), and control groups TE-C (light blue) and LeO-C (orange; sessions 1–30). The vertical dotted lines depict the sessions at which learning criterion was reached by LeO-SCH (session 9) and LeO-C (session 16), and the horizontal arrow depicts the difference between the curves in terms of numbers of sessions (covert learning). (B) Comparison of numbers of sessions to criterion. Same color code as in (A) The mean numbers of sessions required to reach criterion (75% correct responses) are represented for controls (Saline; light blue and orange bars), and experimental groups (SCH23390; red and dark blue bars) for TE and LeO. Note that the y-axis for Saline groups is aligned with session 30 of the experimental groups. ***P < 0.001.
