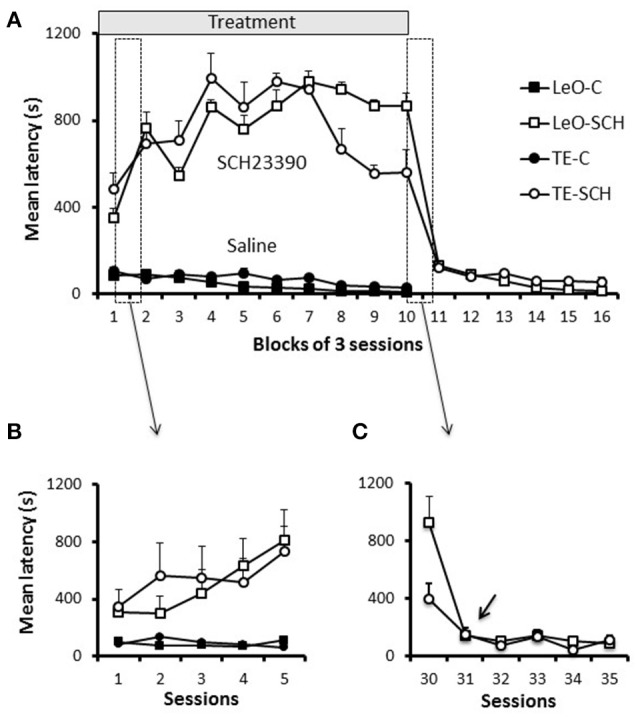
Figure 6.

Latencies. (A) Latencies throughout training. Latencies of first lever contact across groups are plotted per blocks of 3 training sessions. Symbols represent average values across rats, and the bars show the standard error of the mean (sem). The first 5 sessions, which are included in the two boxes (dashed vertical rectangles), are shown in (B,C). (B) Latencies during the first 5 sessions. (C) Latencies for 5 sessions of the transition period from treatment to post-treatment in the experimental groups (TE-SCH, LeO-SCH). The arrow shows that the decrease in latency depicted in (A), between sessions 30 and 33, occurred at session 31.
