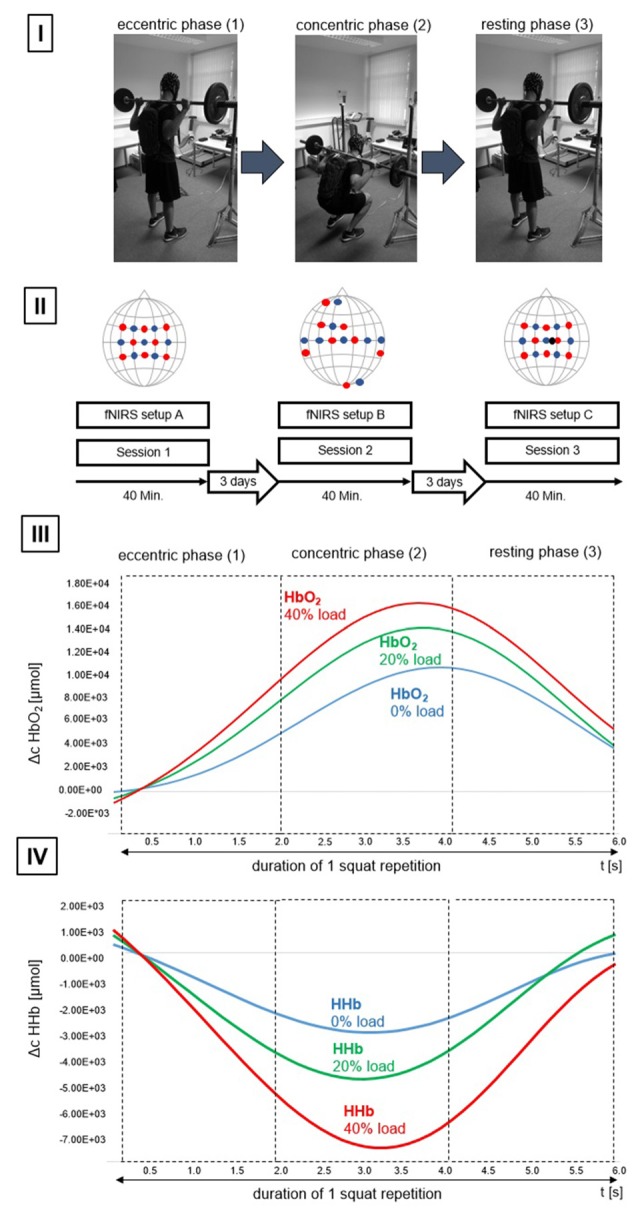
Figure 1.

Study design. (I) Subdivision of the activation phase (barbell squat (BS)). (1) Initiation of the eccentric phase, (2) end of the eccentric phase and subsequent initiation of the concentric phase, (3) end of the concentric phase and concurrently the initial position of the resting phase (R). (II) Overview of the configurations used per session. Illustrated are configurations (functional near-infrared spectroscopy (fNIRS) setup (A), (B) and (C)). Detectors are shown as blue dots, transmitters are shown as red dots. The short—distance detector is shown as a black dot. Also illustrated are time of one session (40 min), as well as the time between individual sessions (3 days). (III) Progression of oxygenated hemoglobin (HbO2) for one repetition. Data is based on mean average progression across all participants. Chromophore progression is illustrated for L0% (blue line), L20% (green line) and L40% (red line) and divided to showcase the different movement phases. (IV) Progression of deoxygenated Hemoglobin (HHb) for one repetition. Data is based on mean average progression across all participants. Chromophore progression is illustrated for L0% (blue line), L20% (green line) and L40% (red line) and divided to showcase the different movement phases. Please note that the participant displayed in (I) gave written informed consent to use the pictures illustrating the study design.
