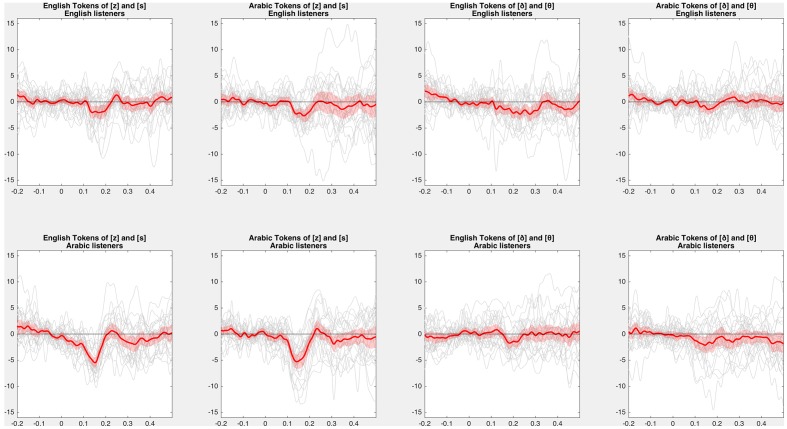
FIGURE 7.
Difference of difference waves. Average (red) and individual (gray) difference of difference waves for each contrast. Difference of differences (voiced deviant in voiceless standard minus voiceless deviant in voiced standard) in each condition show a negative deflection in the MMN window. Red shaded ribbons represent 95% confidence intervals (i.e., the standard error of the grand average times the critical t-value with 23 degrees of freedom) of the MMN asymmetry.

