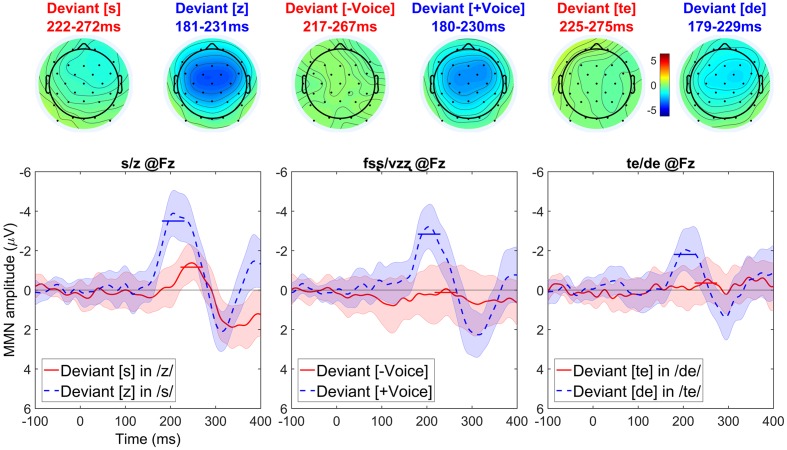
FIGURE 8.
Topographic maps and difference waves (at Fz) for voiceless deviants (red) and voiced deviants (blue). Ribbons indicate a difference-adjusted 95% Cousineau-Morey within-subjects interval (which can be interpreted as follows: at a given time point, if neither condition’s difference-adjusted interval contains the other condition’s mean, then the difference between conditions is likely to be significant at the 95% alpha level, without correction for multiple comparisons). Horizontal lines on the difference waves indicate the average negativity for the 51 ms window centered on the peak. Three contrasts—[s] vs. [z] (left), [fsȿ] vs. [vzʐ] (middle), and [te] vs. [de] (right)—all show the same asymmetrical pattern.

