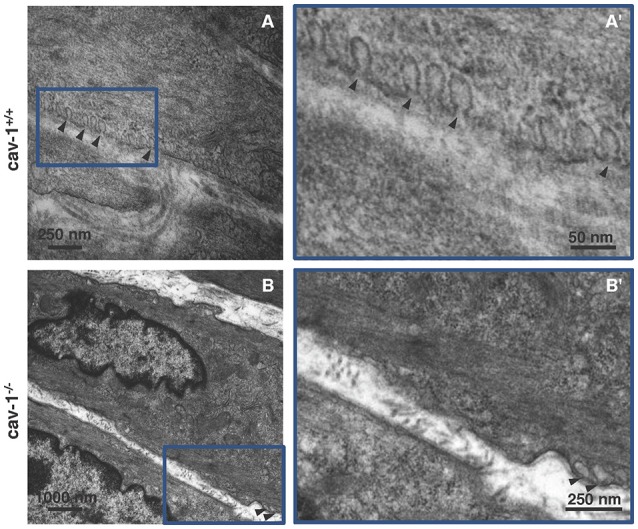
Figure 2.

Ultrastructure of smooth muscle from cav-1+/+ and cav-1−/− mice. Transmission electron microscopy. Images are representative for tracheae of cav-1−/− (n = 6 animals) and cav-1+/+ mice (n = 4 animals). (A,A') Cav-1+/+ mice. Tracheal smooth muscle cells exhibit numerous caveolae that are located in groups at the plasma membrane. (B,B') Cav-1−/− mice. Tracheal smooth muscle cells have low number of caveolae (arrowheads) at the plasma membrane. Caveolae = arrowhead.
