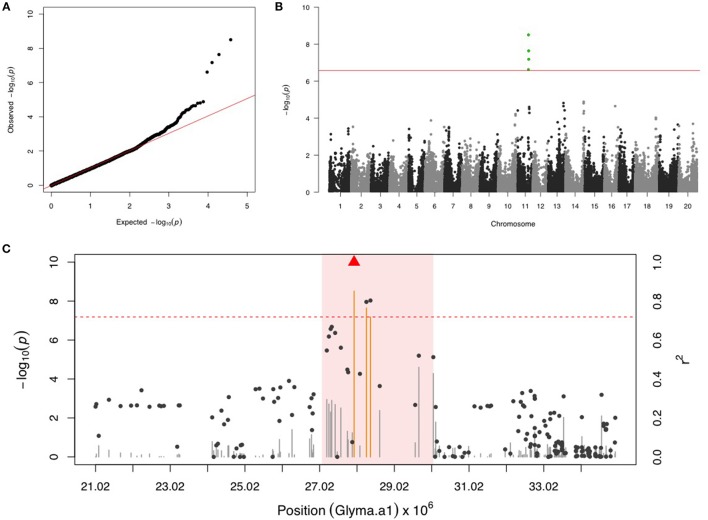
Figure 1.
GWAS for Mexican bean beetle (MBB). (A) Quantile-quantile plot indicates the fitness of the regular MLM for MBB association analysis. (B) Manhattan plot identifies a significant locus on chr 11. Green dots represent the four SNPs with FDR below 0.05. Red horizontal line indicates the Bonferroni threshold. (C) Regional LD analysis that surrounds the most significant SNP (ss715609849), which is below the red triangle. The pairwise LD between SNPs (gray dots) to ss715609849 follows the right y axis. The orange and gray color for lines indicates SNPs with FDR below or above 0.05, respectively, following the left y axis. The red horizontal dash line represents the minimal significant level at the cutoff of FDR 0.05. The pink background highlights the high LD region where candidate genes were examined.

