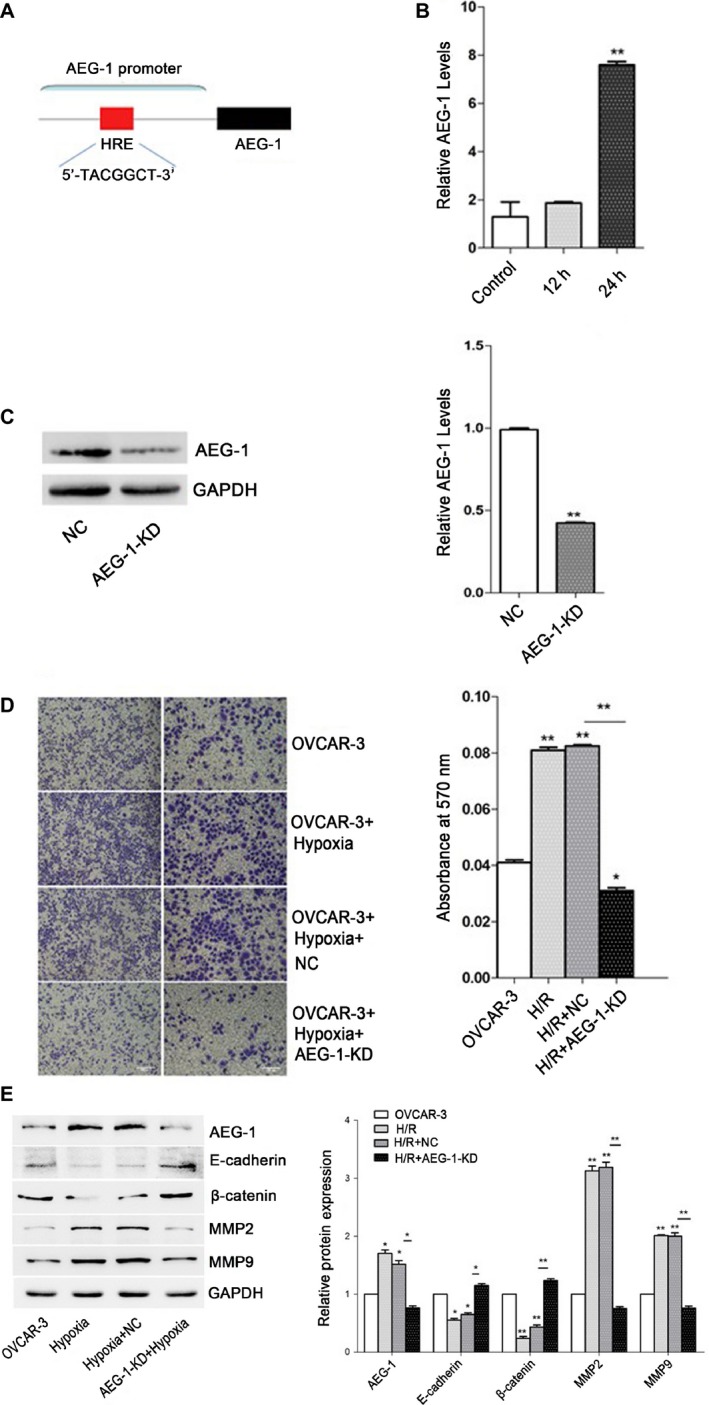
Figure 2.

Invasion capability of OVCAR3 cells increased after hypoxia. OVCAR3 cells were maintained in a humidified atmosphere consisting of 1% CO2 and 99% air for 12h and 24h. Then the cells were collected for qPCR analysis, Western blotting and transwell assay. Data given are mean ± SD, n = 3. (A) Schematic representation of AEG‐1 promoter. (B) The expression of AEG‐1 in OVCAR3 cells after hypoxia and control analyzed by qPCR. ***P <0.001 versus control. (C) The expression of AEG‐1 in OVCAR3 cells after infection with AEG‐1 knock down/negative control lentivirus analyzed by Western blotting. The results were normalized to GAPDH to correct for loading. **P <0.01 versus negative control. (D) Invasion capability of control and OVCAR3 cells after hypoxia, followed by infection with AEG‐1 knock down/negative control lentivirus. The absorbances [optical density (OD)] of invaded cell lysates were read at 570nm. *P <0.05, **P <0.01 versus control. ***P <0.001, OVCAR3 cells after hypoxia and infection with AEG‐1 knockdown lentivirus versus negative control. (E) Protein expressions of AEG‐1, MMP2, MMP9, E‐cadherin and β‐catenin analyzed by Western blotting. The results were normalized to GAPDH to correct for loading. *P <0.05, **P <0.01 versus control.
