Figure 3.

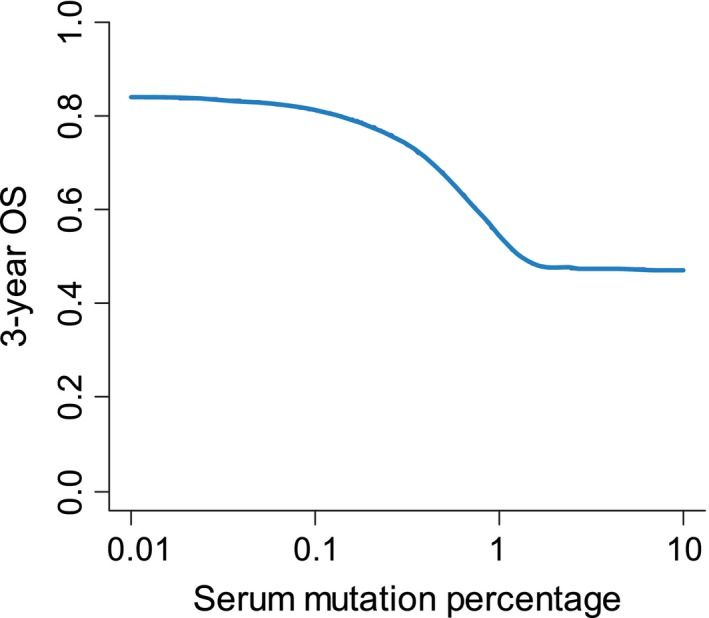
Overall survival for quantitative mutation load. An illustration of the dependence of 3‐year OS on the quantitative measurement of the mutation load. NOTE: Because of the broad range of values, the x‐axis is logarithmic.

Overall survival for quantitative mutation load. An illustration of the dependence of 3‐year OS on the quantitative measurement of the mutation load. NOTE: Because of the broad range of values, the x‐axis is logarithmic.