
Figure 3.
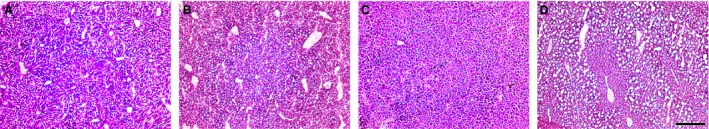
Representative photomicrographs (100× magnification) of the liver in chow‐fed C57Bl/6J mice (A), HFD‐fed C57Bl/6J mice (B), chow‐fed FVB/N mice (C), and HFD‐fed FVB/N mice (D). Scale bar = 250 μm.
Official websites use .gov
A
.gov website belongs to an official
government organization in the United States.
Secure .gov websites use HTTPS
A lock (
) or https:// means you've safely
connected to the .gov website. Share sensitive
information only on official, secure websites.
Representative photomicrographs (100× magnification) of the liver in chow‐fed C57Bl/6J mice (A), HFD‐fed C57Bl/6J mice (B), chow‐fed FVB/N mice (C), and HFD‐fed FVB/N mice (D). Scale bar = 250 μm.