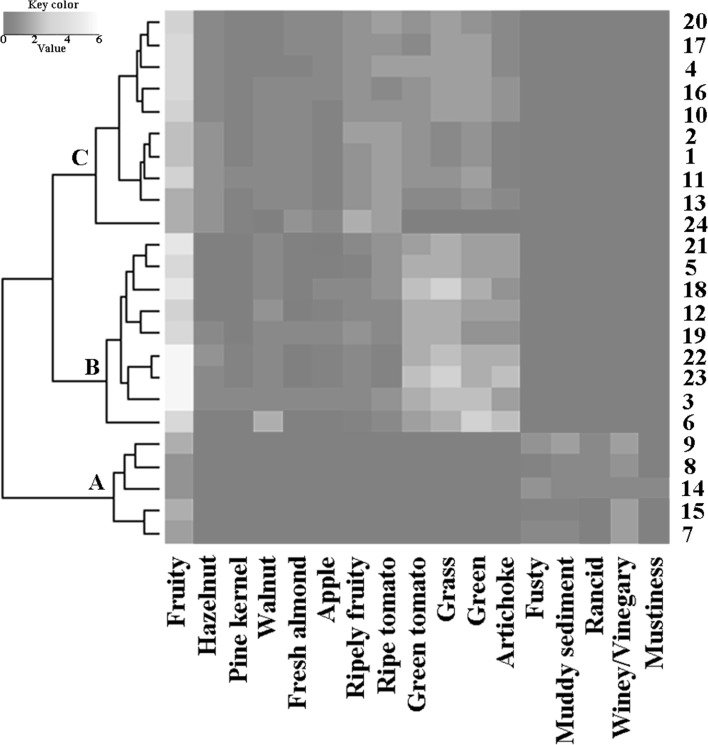
Fig. 1.
Heat map of sensory attributes and one dimensional dendrogram of the 24 olive oil samples. Sensory characteristics are clustered by columns, samples are clustered by rows. Numbers from 1 to 24 are associated to the samples as reported in Table 1; letters A, B, and C individuate the clusters. None autoscaling procedure was utilized for the color-coding

