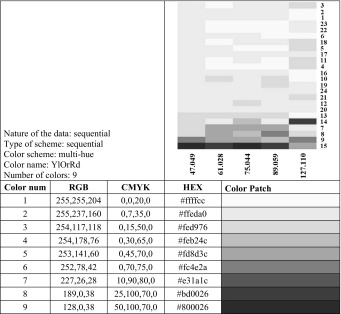
Table 4.
Color-codified heat map concerning relative level of intensity (ncps) for four defective masses in each sample. Numbers from 1 to 18 are associated to the samples as reported in Table 1. Colors from www.ColorBrewer.org by Cynthia A. Brewer, Geography, Pennsylvania State University

