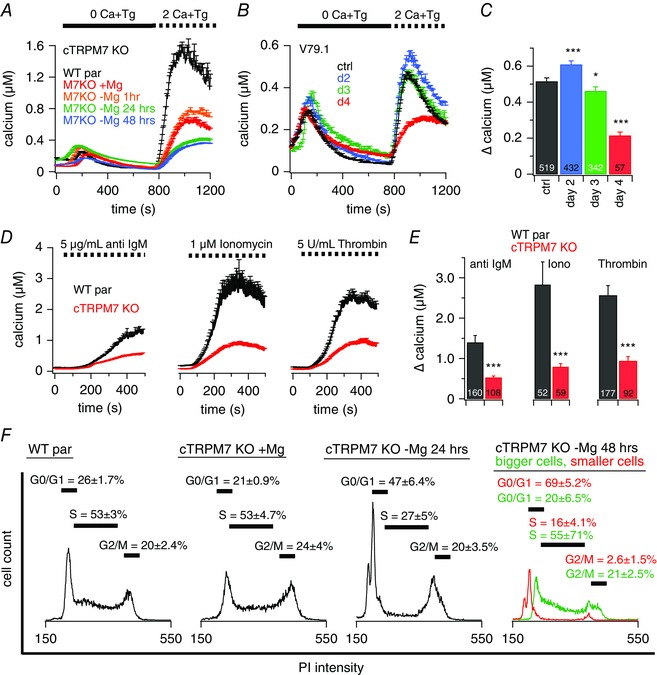
Figure 1. Stable or inducible TRPM7‐KO decreases SOCE.

Ca2+ imaging experiments of intact DT40 chicken B lymphocytes. A–D, at the beginning of the experiment, cells were kept in extracellular standard solution supplemented with 0.5 mm Ca2+. A and B, average [Ca2+]i responses following store depletion by the addition of 5 μm Tg and readdition of 2 mm [Ca2+]o (SOCE) in DT40 WT par cells (n = 469) or TRPM7‐deficient cells (cTRPM7‐KO) and inducible V79.1 TRPM7‐KO DT40 cells (B). A, cTRPM7‐KO cells were kept in medium with or without supplemented 15 mm Mg2+ for the indicated time (+Mg2+, n = 546; –Mg2+ 1 h, n = 304; –Mg2+ 24 h, n = 129, –Mg2+ 48 h, n = 207). Data showing 24 h of Mg2+ exposure (in green) are shifted by +50 nm Ca2+ to make them visible behind the overlapping 48 h of data (in blue). B, KO was induced with tamoxifen and cells were kept in Mg2+ supplemented medium. C, average of Ca2+ influx peaks assessed from baseline and obtained from SOCE measurements in cells in (B). D, average [Ca2+]i responses following store depletion and Ca2+ influx by the addition of 2 mm [Ca2+]o (SOCE) triggered by different stimuli as indicated, in DT40 WT par cells (anti‐IgM n = 207, ionomycin n = 52, thrombin n = 177) or cTRPM7‐KO cells (anti‐IgM n = 108, ionomycin n = 59, thrombin n = 92). E, average Ca2+ influx peaks obtained from SOCE measurements in cells in (D). F, PI based cell cycle analysis of DT40 WT par and cTRPM7‐KO cells kept in medium with or without supplemented 15 mm Mg2+ for the indicated time (representative traces of six independent experiments are shown). Stars indicate statistical significance: * P < 0.05; ** P < 0.01; *** P < 0.001.
