
Figure 2. Impaired SOCE in TRPM7‐deficient B lymphocytes is not due to altered K+ currents.
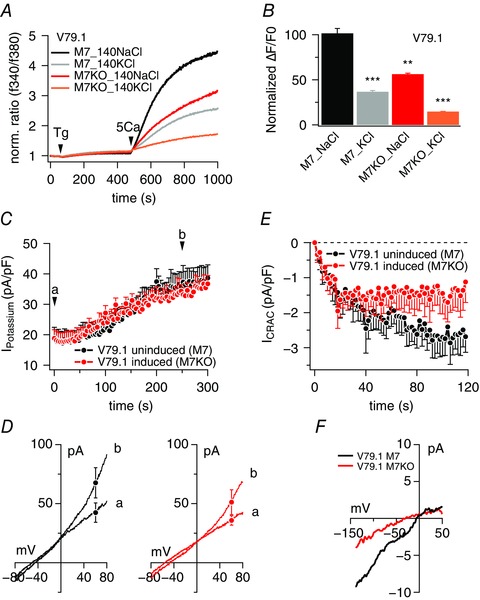
A, average [Ca2+]i responses following store depletion by the addition of 5 μm Tg and readdition of 5 mm [Ca2+]o (SOCE) in uninduced DT40 V79.1 or induced DT40 V79.1. Calcium signals were acquired on a 96‐well fluorescence kinetic plate reader and measured in standard Ringer solution with 140 mm NaCl or in depolarized condition by replacing NaCl with KCl. Data are averages of triplicates. B, average peak Ca2+ influx responses assessed from baseline and obtained in (A) (n = 3 each). Asterisks indicate statistical significance: * P < 0.05; ** P < 0.01; *** P < 0.001. C, time course of average K+ current development in uninduced DT40‐V79.1 cells (n = 9) and in induced DT40 V79.1 (n = 10). Tamoxifen (200 nm) was used to induce TRPM7‐KO and currents were recorded 4 days post‐induction. Cells were held at −80 mV and stimulated with a 50 ms voltage ramp from −100 mV to +100 mV at 0.5 Hz to activate voltage‐gated K+ channels. Cells were concomitantly perfused with 1 μm Ca2+ to activate any additional Ca2+‐sensitive K currents. Currents were extracted at +80 mV, normalized to cell size and plotted as current density in pA/pF over the time of the experiment. D, average I–V behaviour of K+ currents extracted at the two time points labelled (a) and (b) in (C) from uninduced (black I–V traces; n = 9) and induced‐KO cells (red I–V traces; n = 10). E, average CRAC currents (I CRAC) evoked by 20 μm IP3 in uninduced DT40 V79.1 (n = 12) or induced DT40 V79.1 (n = 20). Cells were held at 0 mV and stimulated with a 50 ms voltage ramp from −150 mV to +100 mV at 0.5 Hz. Cells were concomitantly perfused with 20 μm IP3 to activate I CRAC. Currents were extracted at −130 mV, normalized to cell size and plotted as current density in pA/pF over time of the experiment. F, average I–V behaviour of CRAC currents extracted from 116 to 120 s. The black trace represents average current from uninduced cells (n = 6) and the red trace represents average current from M7KO cells (n = 14).