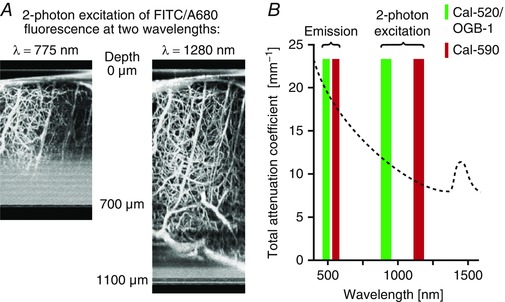
Figure 1. Wavelength‐dependent attenuation length in brain tissue.

A, z‐stack projection of vasculature in the mouse cortex in vivo, recorded by two‐photon excitation at 750 or 1280 nm. The blood vessels are filled with fluorescein isothiocyanate‐dextran and Alexa680‐dextran. Figure adapted from Kobat et al. (2009). B, attenuation coefficient of biological tissue versus wavelength. Coloured bars illustrate the optimum emission and two‐photon excitation wavelength ranges for OGB‐1/Cal‐520 (green) and Cal‐590 (red). Figure adapted from Sordillo et al. (2014).
