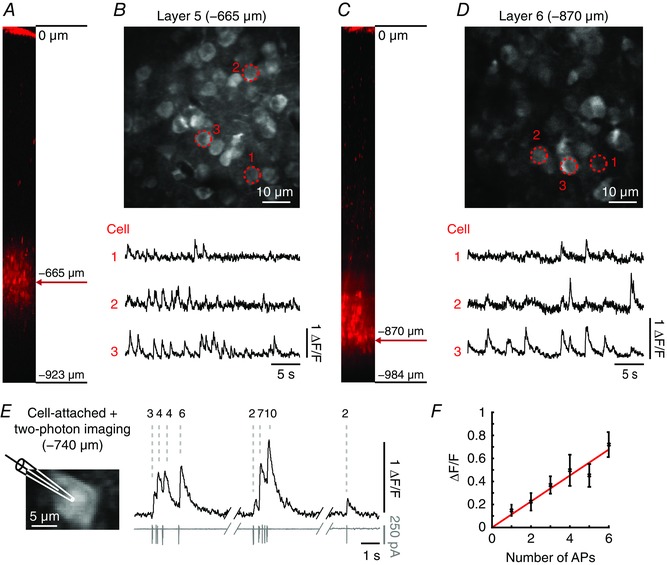
Figure 4. Two‐photon Ca2+ imaging of deep cortical layers 5 and 6 stained with Cal‐590.

Figure adapted from Tischbirek et al. (2015). A, side view of the visual cortex showing layer 5 locally labelled with Cal‐590 AM and the depth from the pial surface (reconstruction from the z‐stack). B, neural population recorded in layer 5 at –665 μm from the pial surface. Bottom, spontaneous Ca2+ transients recorded from the cells marked with red dotted circles. C and D, neural population recorded in layer 6 at –870 μm from the pial surface with corresponding spontaneous activity with the same arrangement as in A and B for layer 5. E, left, image of a neuron in layer 5 at 740 μm below the pial surface stained with Cal‐590 AM with the recording patch‐pipette displayed schematically. Right, fluorescence traces (black, top) and corresponding action potential activity (grey, bottom) with the number of action potentials indicated on top. F, linear relationship between the number of action potentials (x‐axis) and Ca2+ transient amplitudes (y‐axis, mean ± SD). AP, action potential.
