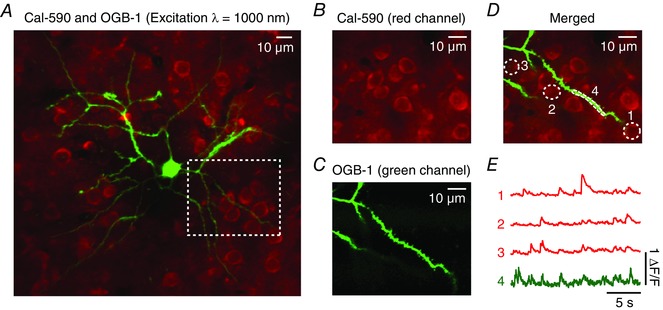
Figure 5. Simultaneous dual‐colour functional Ca2+ imaging.

Figure adapted from Tischbirek et al. (2015). A, overlay of a single cell electroporated with OGB‐1 (green) and a cell population stained with Cal‐590 AM. The two colours were recorded simultaneously by exciting both dyes at a wavelength of 1000 nm. The emission light was separated by optical filters and detected with two photomultiplier tubes (red and green channel). B and C, images obtained from the two photomultiplier tubes separately. The fields of view in both images correspond to the magnified area indicated with a white dotted line in A). D, overlay of the magnified images in B and C with the regions of interest, which are used to determine the fluorescence traces, marked in white. E, Ca2+ transients recorded simultaneously from the somata of the neural population stained with Cal‐590 AM (red channel) and a dendrite of the single cell filled with OGB‐1 (green channel).
