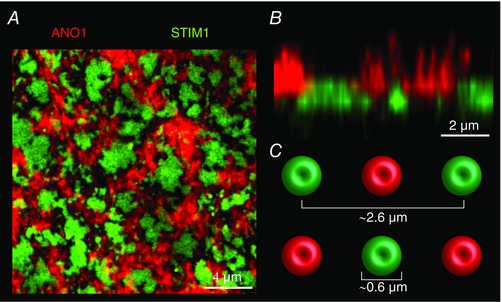
Figure 6. Spatial reorganization of the Ca2+ signalling machinery and effectors in response to Ca2+ store depletion.

A, confocal imaging of Xenopus Ano1 tagged with mCherry (red) and of the ER Ca2+ sensor STIM1 tagged with green fluorescent protein (green) after store depletion induced by IP3 injection. The example is an extreme situation where STIM1 forms large fused clusters that exclude the CaCC Ano1. B, orthogonal reconstruction of a section of the oocyte in A. The microvilli covered by Ano1 are clearly visible as well as the separation between the SOCE domains and the domains painted by Ano1. C, dimensions and spatial spread of the SOCE clusters as measured in Courjaret and Machaca (2014).
