-
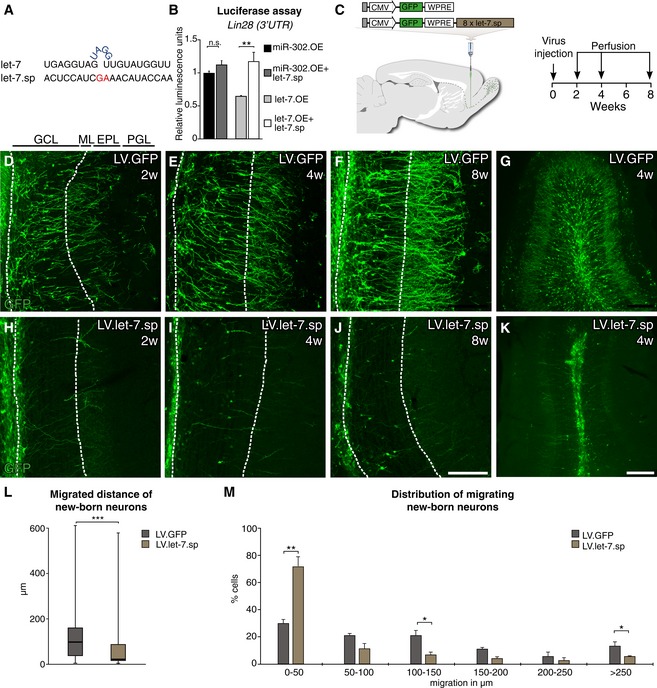
A
Sequences of the mature let‐7 and the let‐7.sp sequence.
-
B
Validation of the let‐7.sp construct by luciferase assay. A miR‐302.OE construct, a miRNA not targeting LIN28, was used as a control; n = 3.
-
C
Vector design and experimental workflow of LV.let‐7.sp and LV.GFP virus injections into the RMS.
-
D–K
Immunohistochemical analyses of the OB of injected animals 2, 4, and 8 weeks after injection. LV.GFP‐expressing cells migrated into the outer layers of the OB at all time points were examined. In contrast, LV.let‐7.sp‐expressing cells migrated into the center of the OB but failed to radially migrate into the outer layers. Layers of the OB are indicated (GCL, granule cell layer; ML, mitral cell layer; EPL, external plexiform layer; PGL, periglomerular layer). Scale bars: 100 μm (D–F and H–J) and 250 μm (G and K).
-
L
Box plot of the migrated distances of all LV.let‐7.sp‐ and LV.GFP‐expressing cells from the center of the OB 4 weeks after LV injection. Boxes represent the 25th and 75th percentiles. Whiskers depict the minimum and maximum values. The median is represented by a horizontal line within the boxes. LV.let‐7.sp n = 97 cells (four animals); LV.GFP n = 100 cells (four animals).
-
M
Migrated distance of new‐born neurons from the center of the OB 4 weeks after LV injection. Data are depicted in a histogram with distinct ranges in μm (x‐axis) plotted against the percentage of cells (y‐axis). LV.GFP n = 4 animals (100 cells); LV.let‐7.sp n = 4 animals (97 cells).
Data information: (B, M) Data are shown as mean ± SEM. (B) One‐sided ANOVA followed by
post hoc Tukey's test, (L) Mann–Whitney U‐test, (M) unpaired two‐tailed
t‐test; *
P < 0.05, **
P < 0.01, ***
P < 0.001.