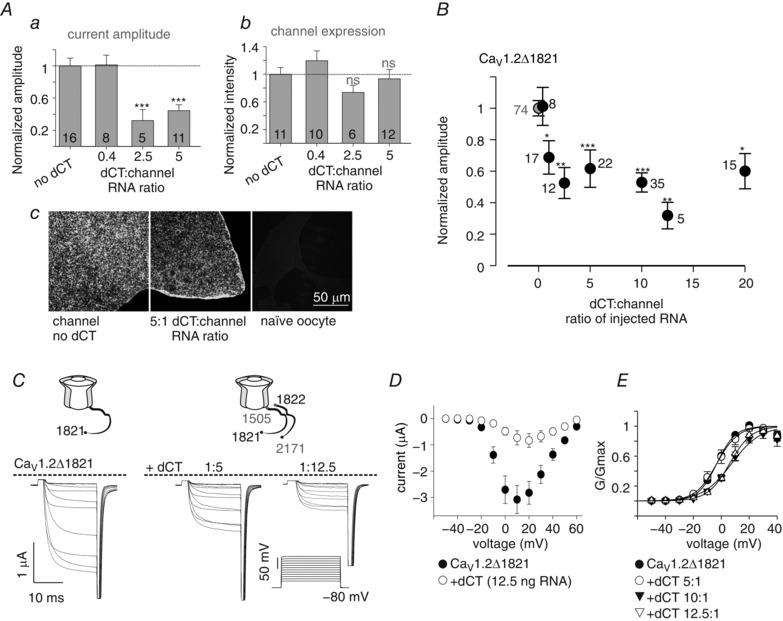
Figure 4. Overexpression of dCT reduces basal I Ba amplitude and depolarizes the activation curve.

A, I Ba amplitudes at +20 mV (a) and plasma membrane expression (b) were measured in oocytes expressing CaV1.2Δ1821 together with increasing levels of dCT. In each experiment both current amplitude and surface labelling intensity were measured and normalized to the group expressing the channel alone. Statistical significance was determined by one‐way ANOVA followed by Bonferroni test. *** P < 0.001; ns, not significant. N = 3 experiments. c, examples of confocal images of giant membrane patches, where the channel levels were quantified with CaV1.2 antibody directed to an intracellular loop. B, dose‐dependent reduction of I Ba by coexpressed dCT. Oocytes were injected with 1 ng RNA CaV1.2Δ1821 together with increasing amounts of dCT RNA. The leftmost grey point represents channels expressed without dCT. In each experiment, I Ba amplitude was normalized to average I Ba in the control group expressing the channel alone. N = 11 experiments. Statistical significance was determined by one‐way ANOVA followed by Bonferroni test. * P < 0.05; ** P < 0.01; *** P < 0.001. C and D, current–voltage (I–V) relationships in oocytes expressing 1 ng CaV1.2Δ1821 and no dCT or 5 or 12.5 ng dCT RNA, from a representative experiment (n = 5–7 oocytes). Representative records of net I Ba (C) and averaged I–V curves (D). E, averaged conductance–voltage relationships from 3 experiments (n = 25 without dCT, and n = 5–9 with the different doses of dCT RNA). The Boltzmann equation fit parameters are shown in Table 2.
