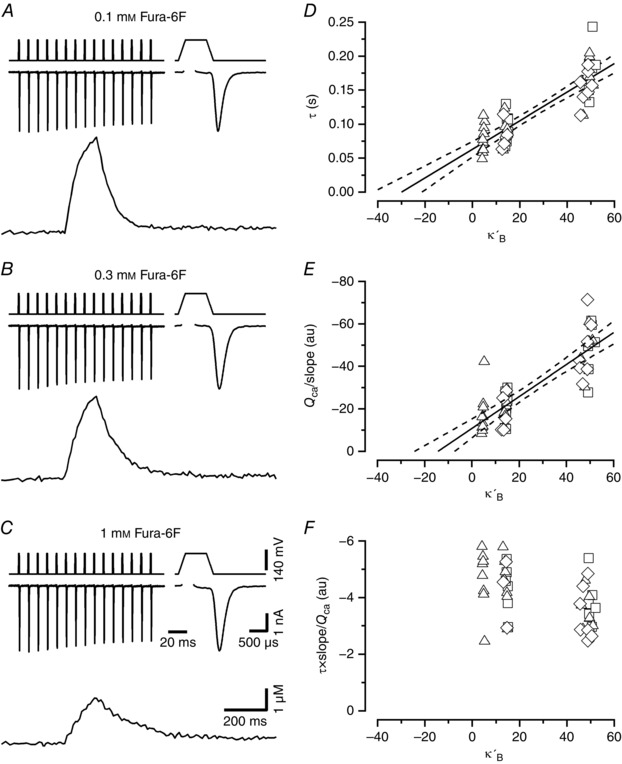
Figure 1. Evaluation of the Ca2+ binding ratio κs of endogenous fixed Ca2+ buffers.

A–C, example traces of presynaptic I Ca (top) together with the corresponding [Ca2+]i transients (bottom) elicited by stimulus trains and recorded in calyx of Held terminals. The first I Ca waveform of the trains is shown at a faster time scale (top right) in the top row of each panel. Voltage‐clamp protocols are shown above I Ca. Stimulus trains consisted of 15 APW depolarizations delivered at a frequency of 100 Hz. APWs consisted of a variable length depolarization to +60 mV (0.2, 0.6 or 1 ms) embedded in two ramps of 0.2 ms duration (from −80 to +60 mV and from +60 to −80 mV). Terminals were loaded with either 0.1 mm (A), 0.3 mm (B) or 1 mm (C) Fura‐6F. For the sample traces shown, peak [Ca2+]i was 4.60 μm (A), 4.02 μm (B) and 2.28 μm (C). Calibration bars in C also apply to A and B. D, decay time constants of the [Ca2+]i transients plotted versus the Ca2+ binding ratios κ′B of Fura‐6F for I Ca evoked by 0.2 ms (squares), 0.6 ms (triangles) and 1 ms (diamonds) APWs. Pooled data obtained from 10 (0.1 mm Fura‐6F), 8 (0.3 mm Fura‐6F) and 7 (1 mm Fura‐6F) calyx terminals. The data are clustered along the x‐axis, with each cluster corresponding to one of the three Fura‐6F concentrations used (0.1 mm left, 0.3 mm middle, 1 mm right). The x‐values within clusters scatter slightly due to differences in peak amplitudes of the respective [Ca2+]i transients. A line fit to the data yields a κs estimate of 29.0 ± 4.9 μm. E, when plotting the ratio Q Ca over initial rate of rise of the [Ca2+]i transients in a similar way as shown in D, the estimated κs amounts to 13.3 ± 4.1 μm. Solid and broken lines in D and E represent regression lines and 95% confidence limits, respectively. Error estimates for κs values were derived from bootstrap analysis using a resampling n of 10,000. F, the ratio of the two quantities shown in D and E is plotted. This ratio should be independent of κ′B, since the influence of the latter is cancelled out. This holds for the comparison of values obtained with 0.1 and 0.3 mm Fura‐6F. However, the mean value for the data obtained with 1 mm Fura‐6F in the pipette (−3.10 ± 0.15×10⁶) is slightly smaller than the mean of the pooled data using 0.1 or 0.3 mm Fura‐6F (−4.29 ± 0.19×10⁶).
