
Figure 2. Time course of [Ca2+]i transients in the near absence of mobile Ca2+ buffers using either Cs+‐ or K+‐based pipette filling solutions.
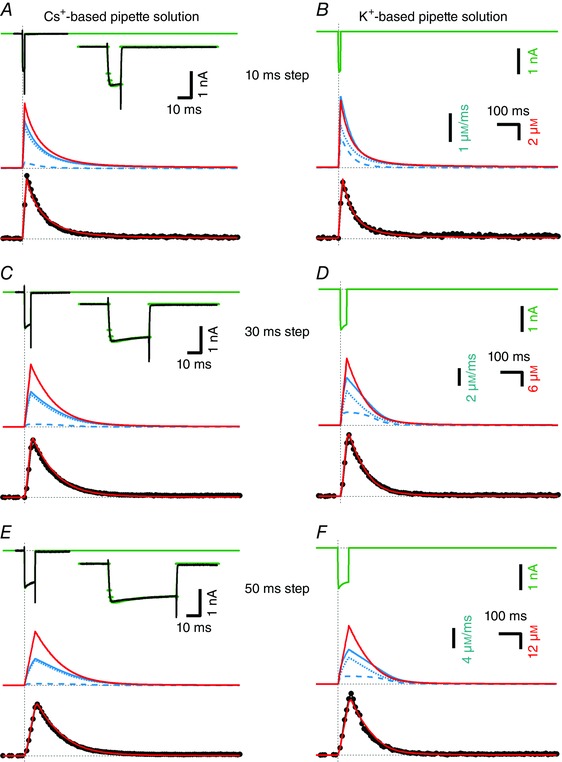
In each panel, measured [Ca2+]i transients (black, bottom) in response to depolarizing voltage‐clamp pulses are compared with the modelled [Ca2+]i (red, middle and bottom). Patch pipettes contained 50 μm EGTA and 100 μm Fura‐6F in all experiments illustrated. A, top, I Ca (black) evoked by a depolarizing voltage step (10 ms to 0 mV) was measured with Cs+‐based pipette solution and is shown superimposed onto the modelled I Ca (green). The inset shows measured and modelled I Ca at a faster time scale. Middle, modelled [Ca2+]i transient (red trace) and Ca2+ extrusion rate j ex (solid blue trace) and its components j ex,Hill (blue broken trace) and j ex,MM (blue dotted trace) are shown at high temporal resolution (Δt = 1 ms). Bottom, modelled (red) and measured (black) [Ca2+]i transients shown superimposed. The modelled [Ca2+]i transient was binned using 10 ms time intervals that were shifted for optimal alignment with the measured trace. C and E, data obtained from the same calyx terminal during similar experiments as shown in A except that the durations of the depolarizing voltage steps were 30 ms (C) and 50 ms (E). The measured peak [Ca2+]i was 8.06 μm (A), 24.4 μm (C) and 40.3 μm (E). B, D and F, similar experiments as illustrated in A, C and E but using K+‐based pipette solution. Since I Ca could not be recorded in isolation under these experimental conditions, only the modelled I Ca (green) is shown. The measured peak [Ca2+]i was 7.16 μm (B), 26.0 μm (D) and 47.7 μm (F). The least‐squares fits to the data shown in A, C and E used 80 data points of the sampled [Ca2+]i transient, starting at onset of the presynaptic depolarization and ending 0.8 s later. The fit to the data shown in B used 37 data points and the fits to the data shown in D and F used 60 data points.