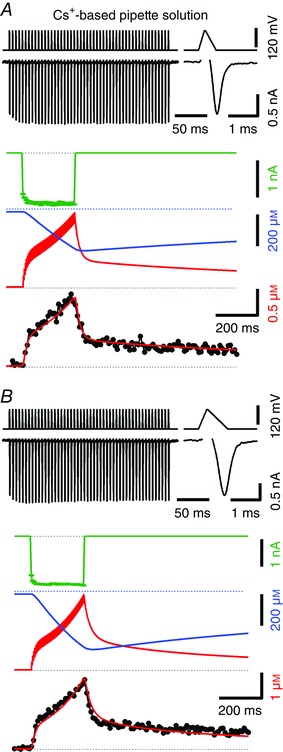
Figure 5. Time course of [Ca2+]i transients in response to train stimulation in the presence of 500 μm EGTA in the cytosol.

Similar experiment as illustrated in Fig. 4 using Cs+‐based pipette solution containing 100 μm Fura‐6F and 500 μm EGTA but stimulated with 200 Hz trains consisting of 50 AP‐like waveforms (APWs). The shape of the APWs was designed to approximate the time course of the recorded calyceal APs at P7 and P14 shown in Taschenberger & von Gersdorff (2000, their fig. 1A). A, narrow APWs that mimic mature calyceal APs were applied, which generate relatively small I Ca (−1.38 nA for the final I Ca). These APWs consisted of an initial ramp from −80 to +40 mV (200 μs), followed by a plateau at +40 mV (40 μs) and finally a ramp from +40 mV back to −80 mV (360 μs). Measured I Ca is shown in black (top left) together with the voltage‐clamp train protocol. The first I Ca of the train is shown at a faster time scale (top right). The simulated I Ca that was used to drive the model is shown in green (middle). The predicted time courses of the concentration of free EGTA and [Ca2+]i are shown at high temporal resolution (Δt = 1 ms) in blue and red, respectively (middle). [Ca2+]i peaked at ∼1.38 μm at the end of the train while free EGTA dropped to ∼50% of its initial value. The bottom row shows modelled (red) and measured (black) [Ca2+]i transients superimposed. The modelled [Ca2+]i transient was binned using 10 ms time intervals and shifted for optimal alignment with the measured trace. Eighty data points of the sampled [Ca2+]i transient from the start of the stimulus train up to 0.8 s later were included in the model fit. B, similar experiment as shown in A obtained from the same calyx terminals, except that wider APWs mimicking immature calyceal APs were applied which gave rise to a ∼27% larger I Ca (−1.75 nA for the final I Ca). These APWs consisted of an initial ramp from −80 to +40 mV (280 μs), followed by a plateau at +40 mV (40 μs) and finally a ramp from +40 mV back to −80 mV (680 μs). Using this stimulus protocol, [Ca2+]i peaked at ∼2.73 μm at the end of the train while free EGTA dropped to ∼28 % of its initial value. In total, 54 data points from the start of the stimulus train up to 0.54 s later were included in the calculation of least‐squares fits.
