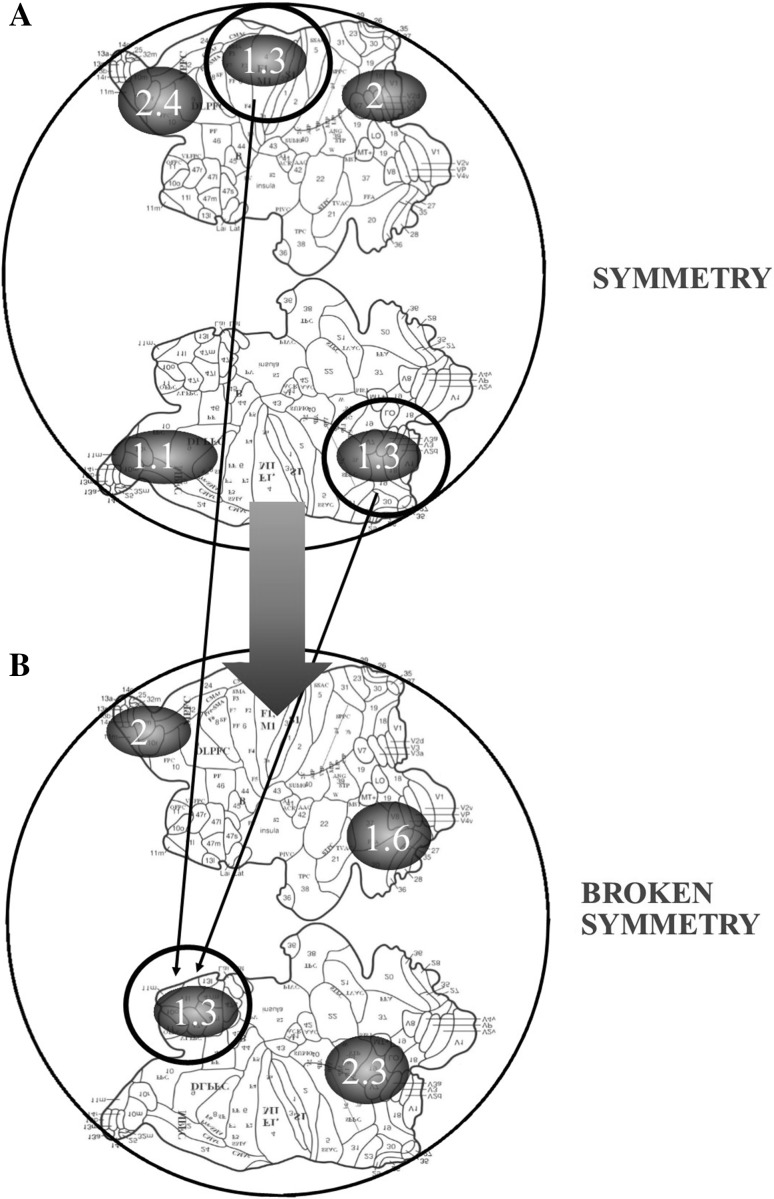
Fig. 2.
The two brain hemispheres are flattened and displayed in 2D, according to Van Essen (2005). The black circles, depicting hypothetical micro-areas of BOLD signal during fMRI functional studies, contain a number which stands for the corresponding entropy value. a displays a functional state with preserved symmetry (e.g., mind wandering), while b one with symmetry breaking (e.g., a task-related activity). Note that two micro-areas with the same entropy values in a stand for two points with matching description. The latter necessarily project to a single point, in case the brain symmetry is broken, according to the dictates of gen-BUT. This means that in b there must be a micro-area with the same entropy value of the two matching points in a. It allows us to assess which zones of the brain could be correlated during functional symmetry breaks

