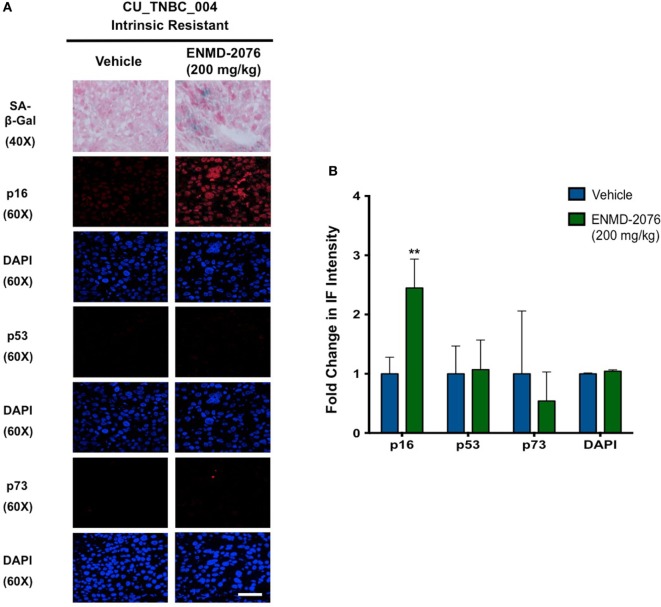
Figure 5.
Effects of ENMD-2076 treatment on SA-β-Gal, p16, p53, and p73 expression in PDX models exhibiting initial resistance to ENMD-2076 treatment. (A) Senescence and immunofluorescence (IF) analysis of tumors harvested from CU_TNBC_004 treated with vehicle control and ENMD-2076 treated. ENMD-2076 treatment was administered at 200 mg/kg once daily by oral gavage. Representative images for SA-β-gal expression were acquired using a Zeiss microscope at 40× magnification. Scale = 5μm. Note the presence of blue SA-β-gal staining in the ENMD-2076 treated group. Representative IF images were acquired using confocal microscopy at 60× magnification. Scale = 5μm. (B) Quantification of mean pixel intensity of the IF analysis. **p < 0.01, ***p < 0.001, ****p < 0.0001.

