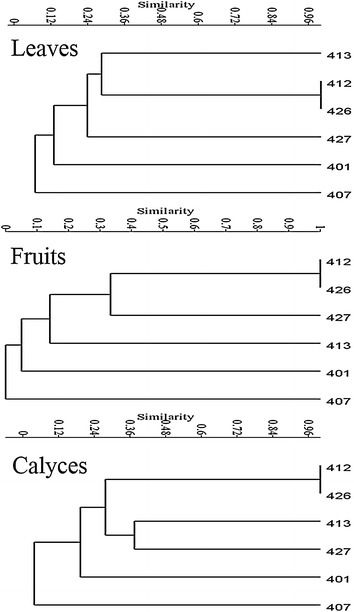
Fig. 4.

Results of the cluster analysis based on the phenolic profiles of five species of Physalis. The dendrogram was generated with the Paired Group Algorithm and the Jaccard’s Similarity Measure, for comparing foliar, fruit and calyx phenolic profiles for five wild species of Physalis. The reference number of samples corresponds to those of Table 1
