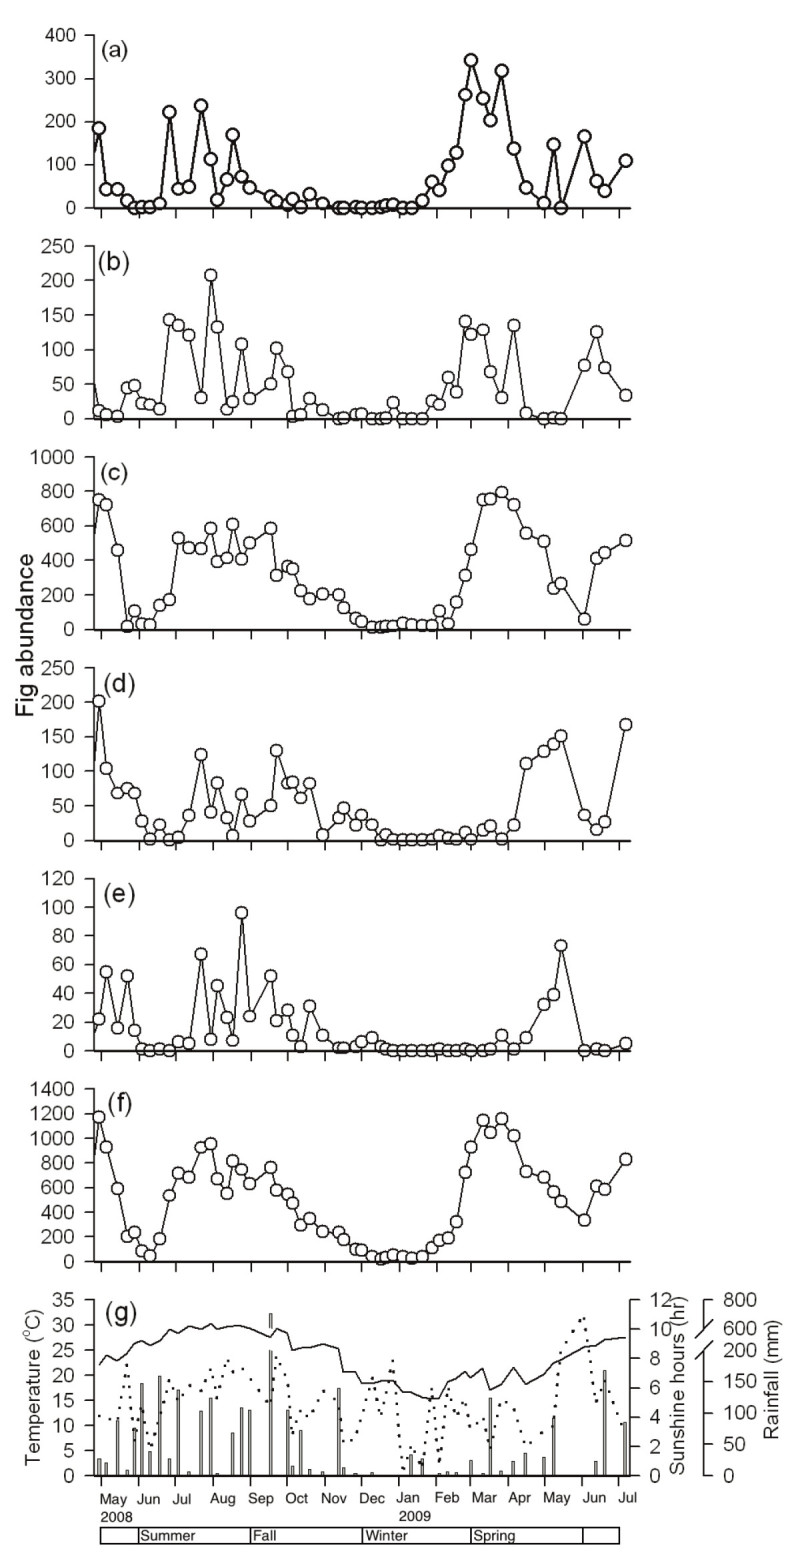
Figure 3.

Syconia abundance in each phase of F. microcarpa and the meteorological data in Taipei from April 28th, 2008 to July 5th, 2009: (a) A phase, (b) B phase, (c) C phase, (d) D phase, (e) E phase, (f) total syconia, and (g) meteorological data. Solid lines represent temperature; dotted lines, sunshine hours; and bars, rainfall.
