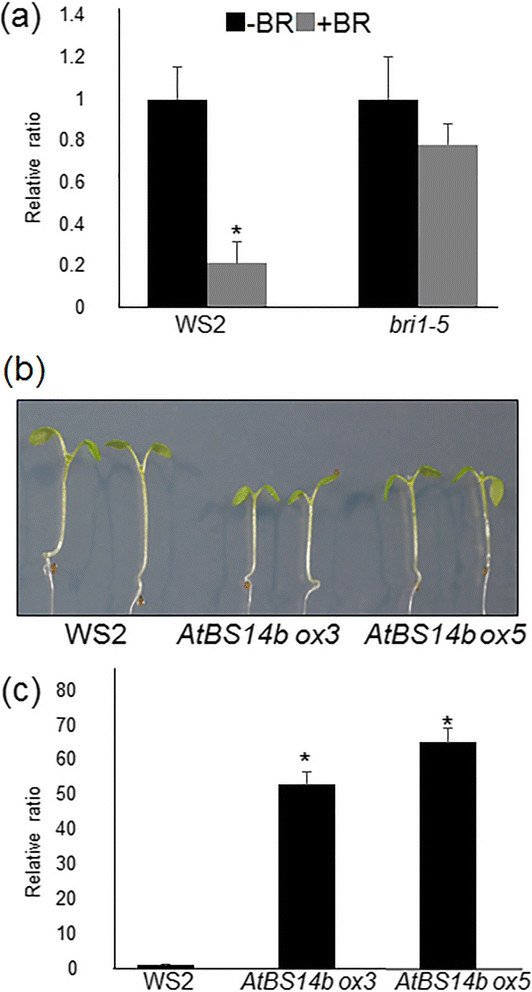
Figure 3.

AtBS14b expression levels and phenotype of AtBS14b overexpression plants. (a) Seedlings grown on half MS medium for 7 days before treat 1 μM BL for 3 hours. AtBS14b expression level was repressed by BL treatment. (b) AtBS14b overexpression lines (ox3 and ox5) were grown on half MS media under continuous dim light for 7 days, and WS2 and AtBS14b overexpression plants were photographed. (c) AtBS14b expression levels from WS2 and AtBS14b overexpression plants were analyzed by qRT-PCR. Actin was used as an internal control and the experiments were repeated at least three times with more than 10 plants were analyzed each time (*P < 0.001 t test).
