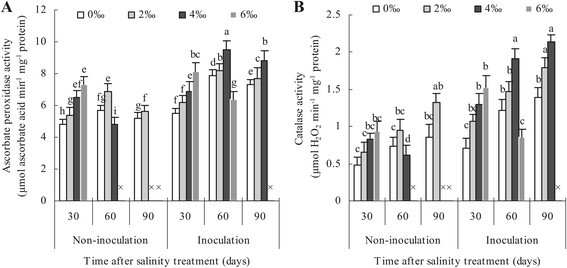
Figure 2.

Ascorbate peroxidase activity (A) and catalase activity (B) of apple leaves inoculated and non-inoculated with Glomus versiforme . Each bar represents a mean ± standard deviations. Each value represents the mean of 6 replicates. The sign “×” denotes that apple plants were dead.
